Quick Start Guide
Get started with SIB in under 5 minutes.
60-Second Demo
git clone https://github.com/matijazezelj/sib.git
cd sib
cp .env.example .env
make install
make demo
Open Grafana at http://localhost:3000 and watch the dashboards light up!
Understanding the Demo
The make demo command generates realistic security events across all MITRE ATT&CK categories. The demo spins up a temporary container and triggers various Falco rules.
Demo Coverage
| Tactic | Events Generated |
|---|---|
| Credential Access | Shadow file access, /etc/passwd reads |
| Execution | Shell spawning, script execution |
| Persistence | Cron job creation, systemd manipulation |
| Defense Evasion | Log clearing, history deletion |
| Discovery | System enumeration, network scanning |
| Impact | Crypto miner detection |
| Container Escape | Docker socket access, namespace breakout |
| Lateral Movement | SSH key access, authorized_keys reads |
| File Integrity | /etc/ file modifications |
Demo Options
# Full comprehensive demo (~30 events with 3s delays)
make demo

# Quick demo (1-second delays)
make demo-quick

# Single test alert
make test-alert
Exploring the Dashboards
Security Overview
Navigate to Dashboards → Security Overview
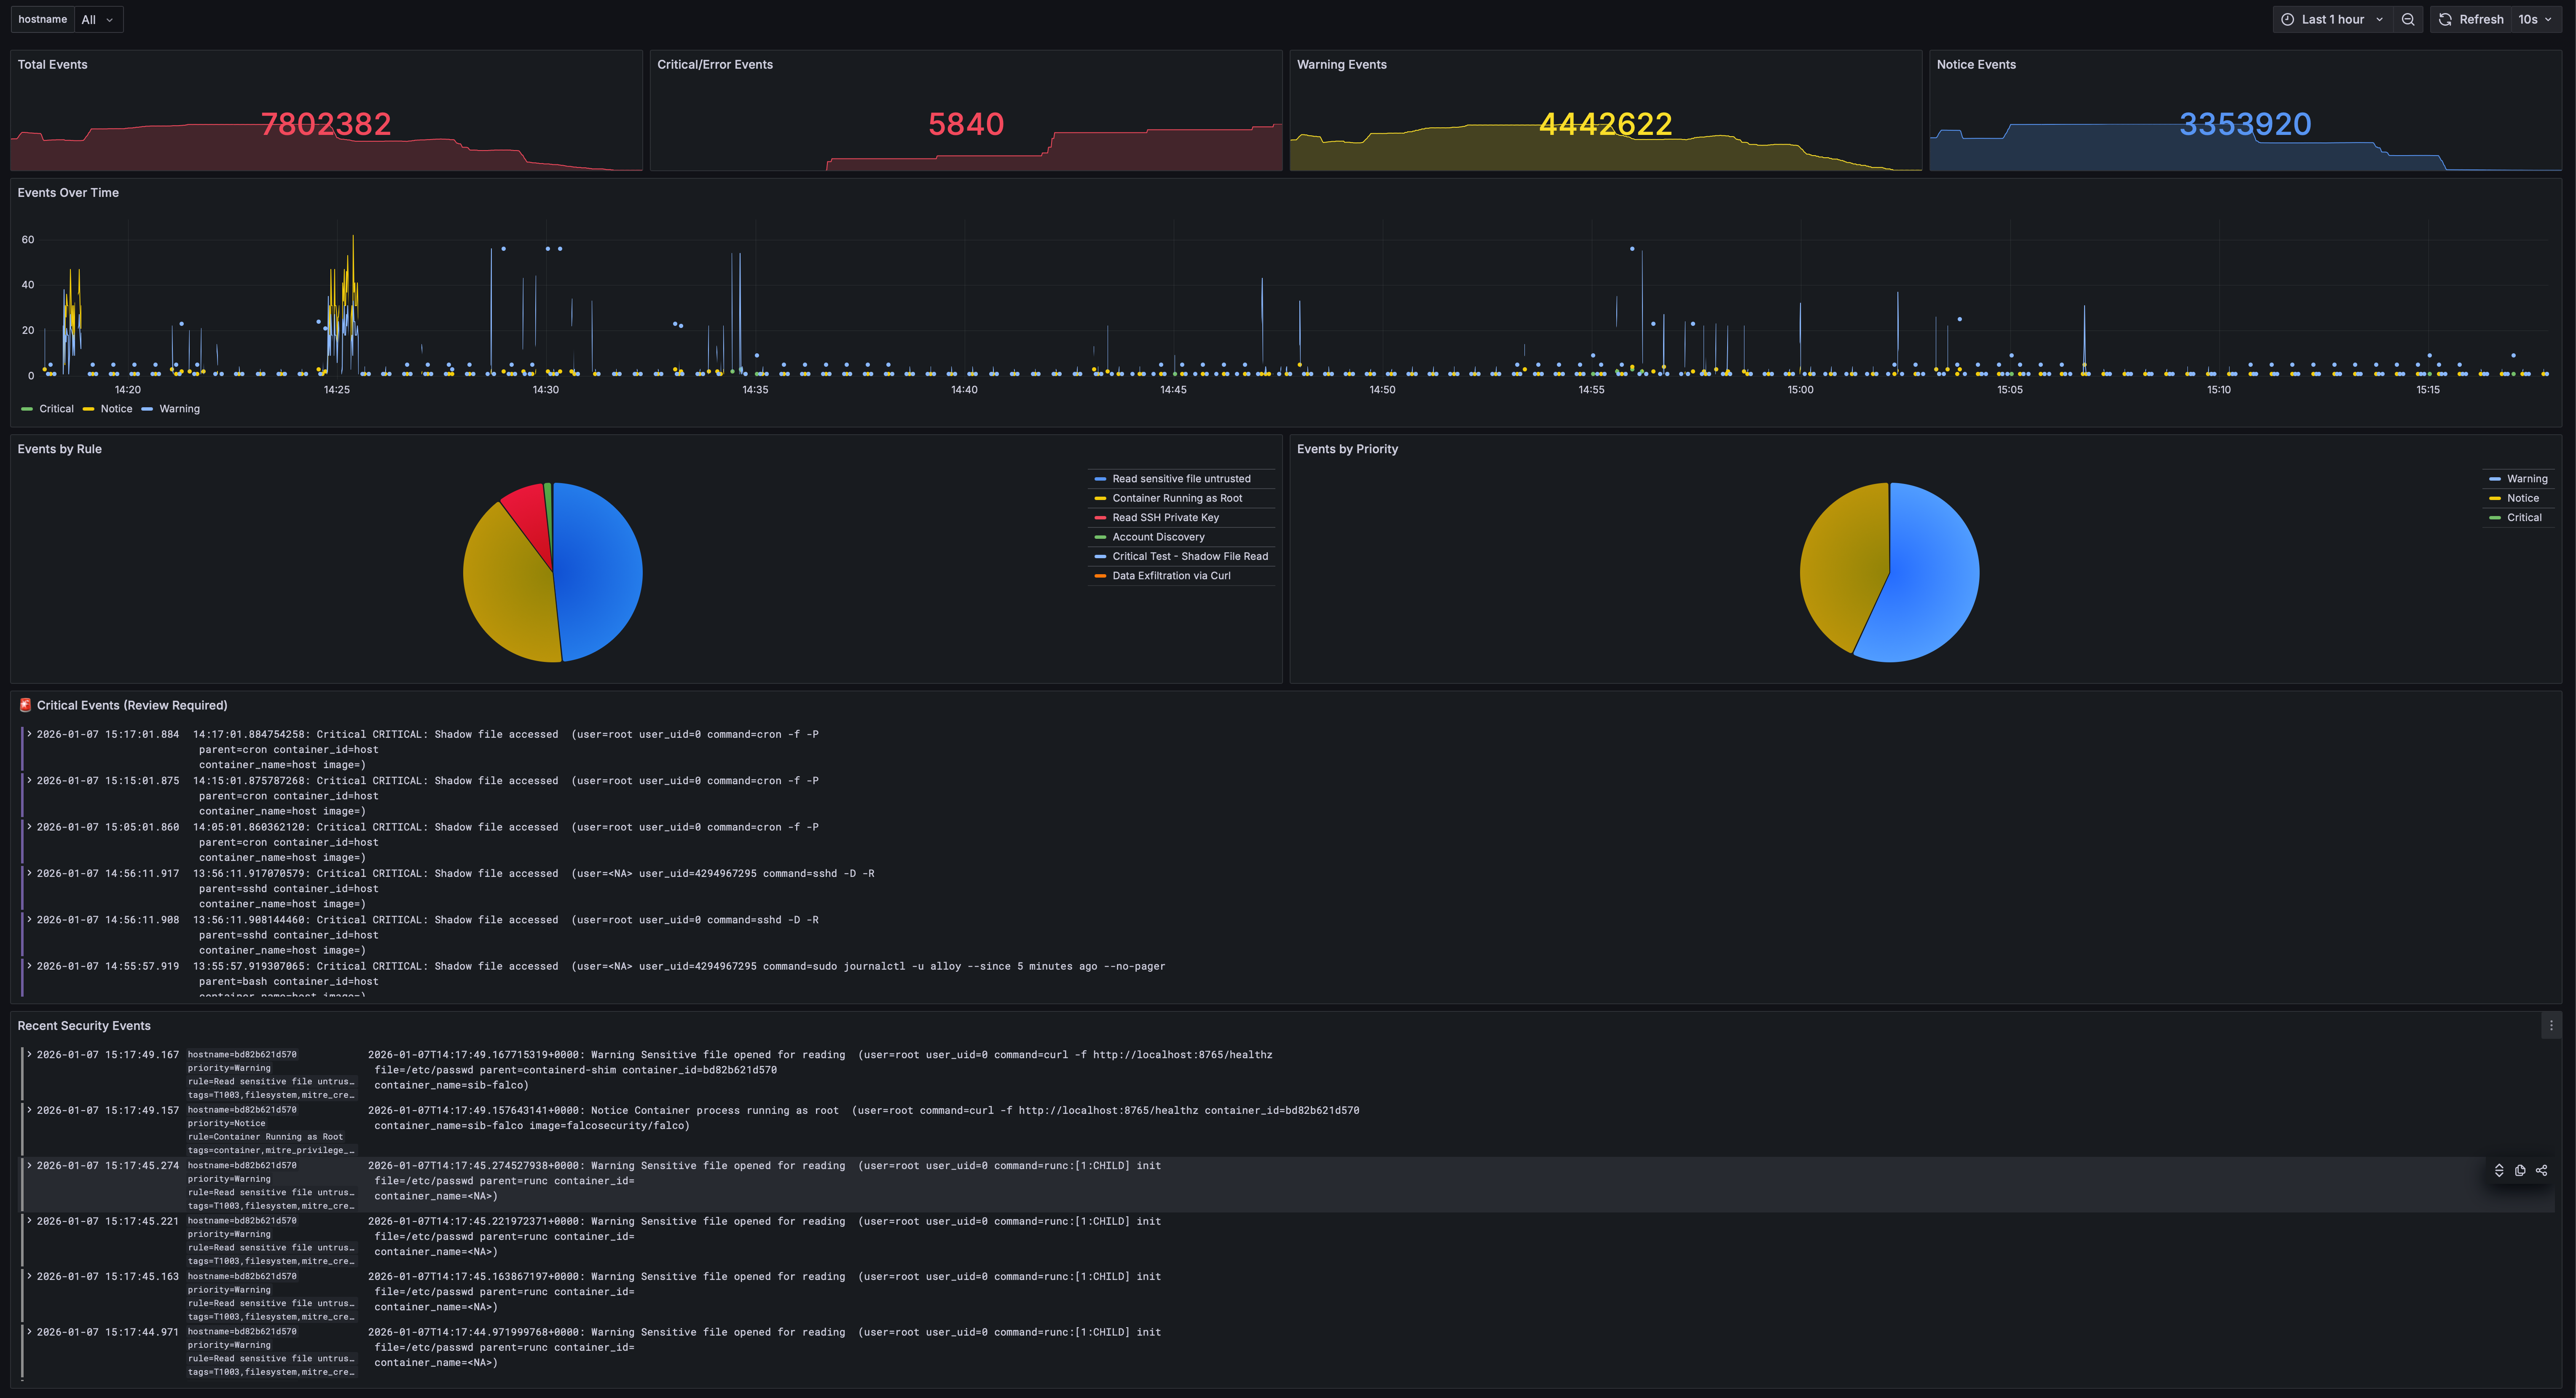
This dashboard shows:
- Total events, Critical/Error/Warning/Notice counts
- Events over time by priority
- Events by rule (pie chart)
- Critical Events panel
- Recent security events log
Events Explorer
Navigate to Dashboards → Events Explorer
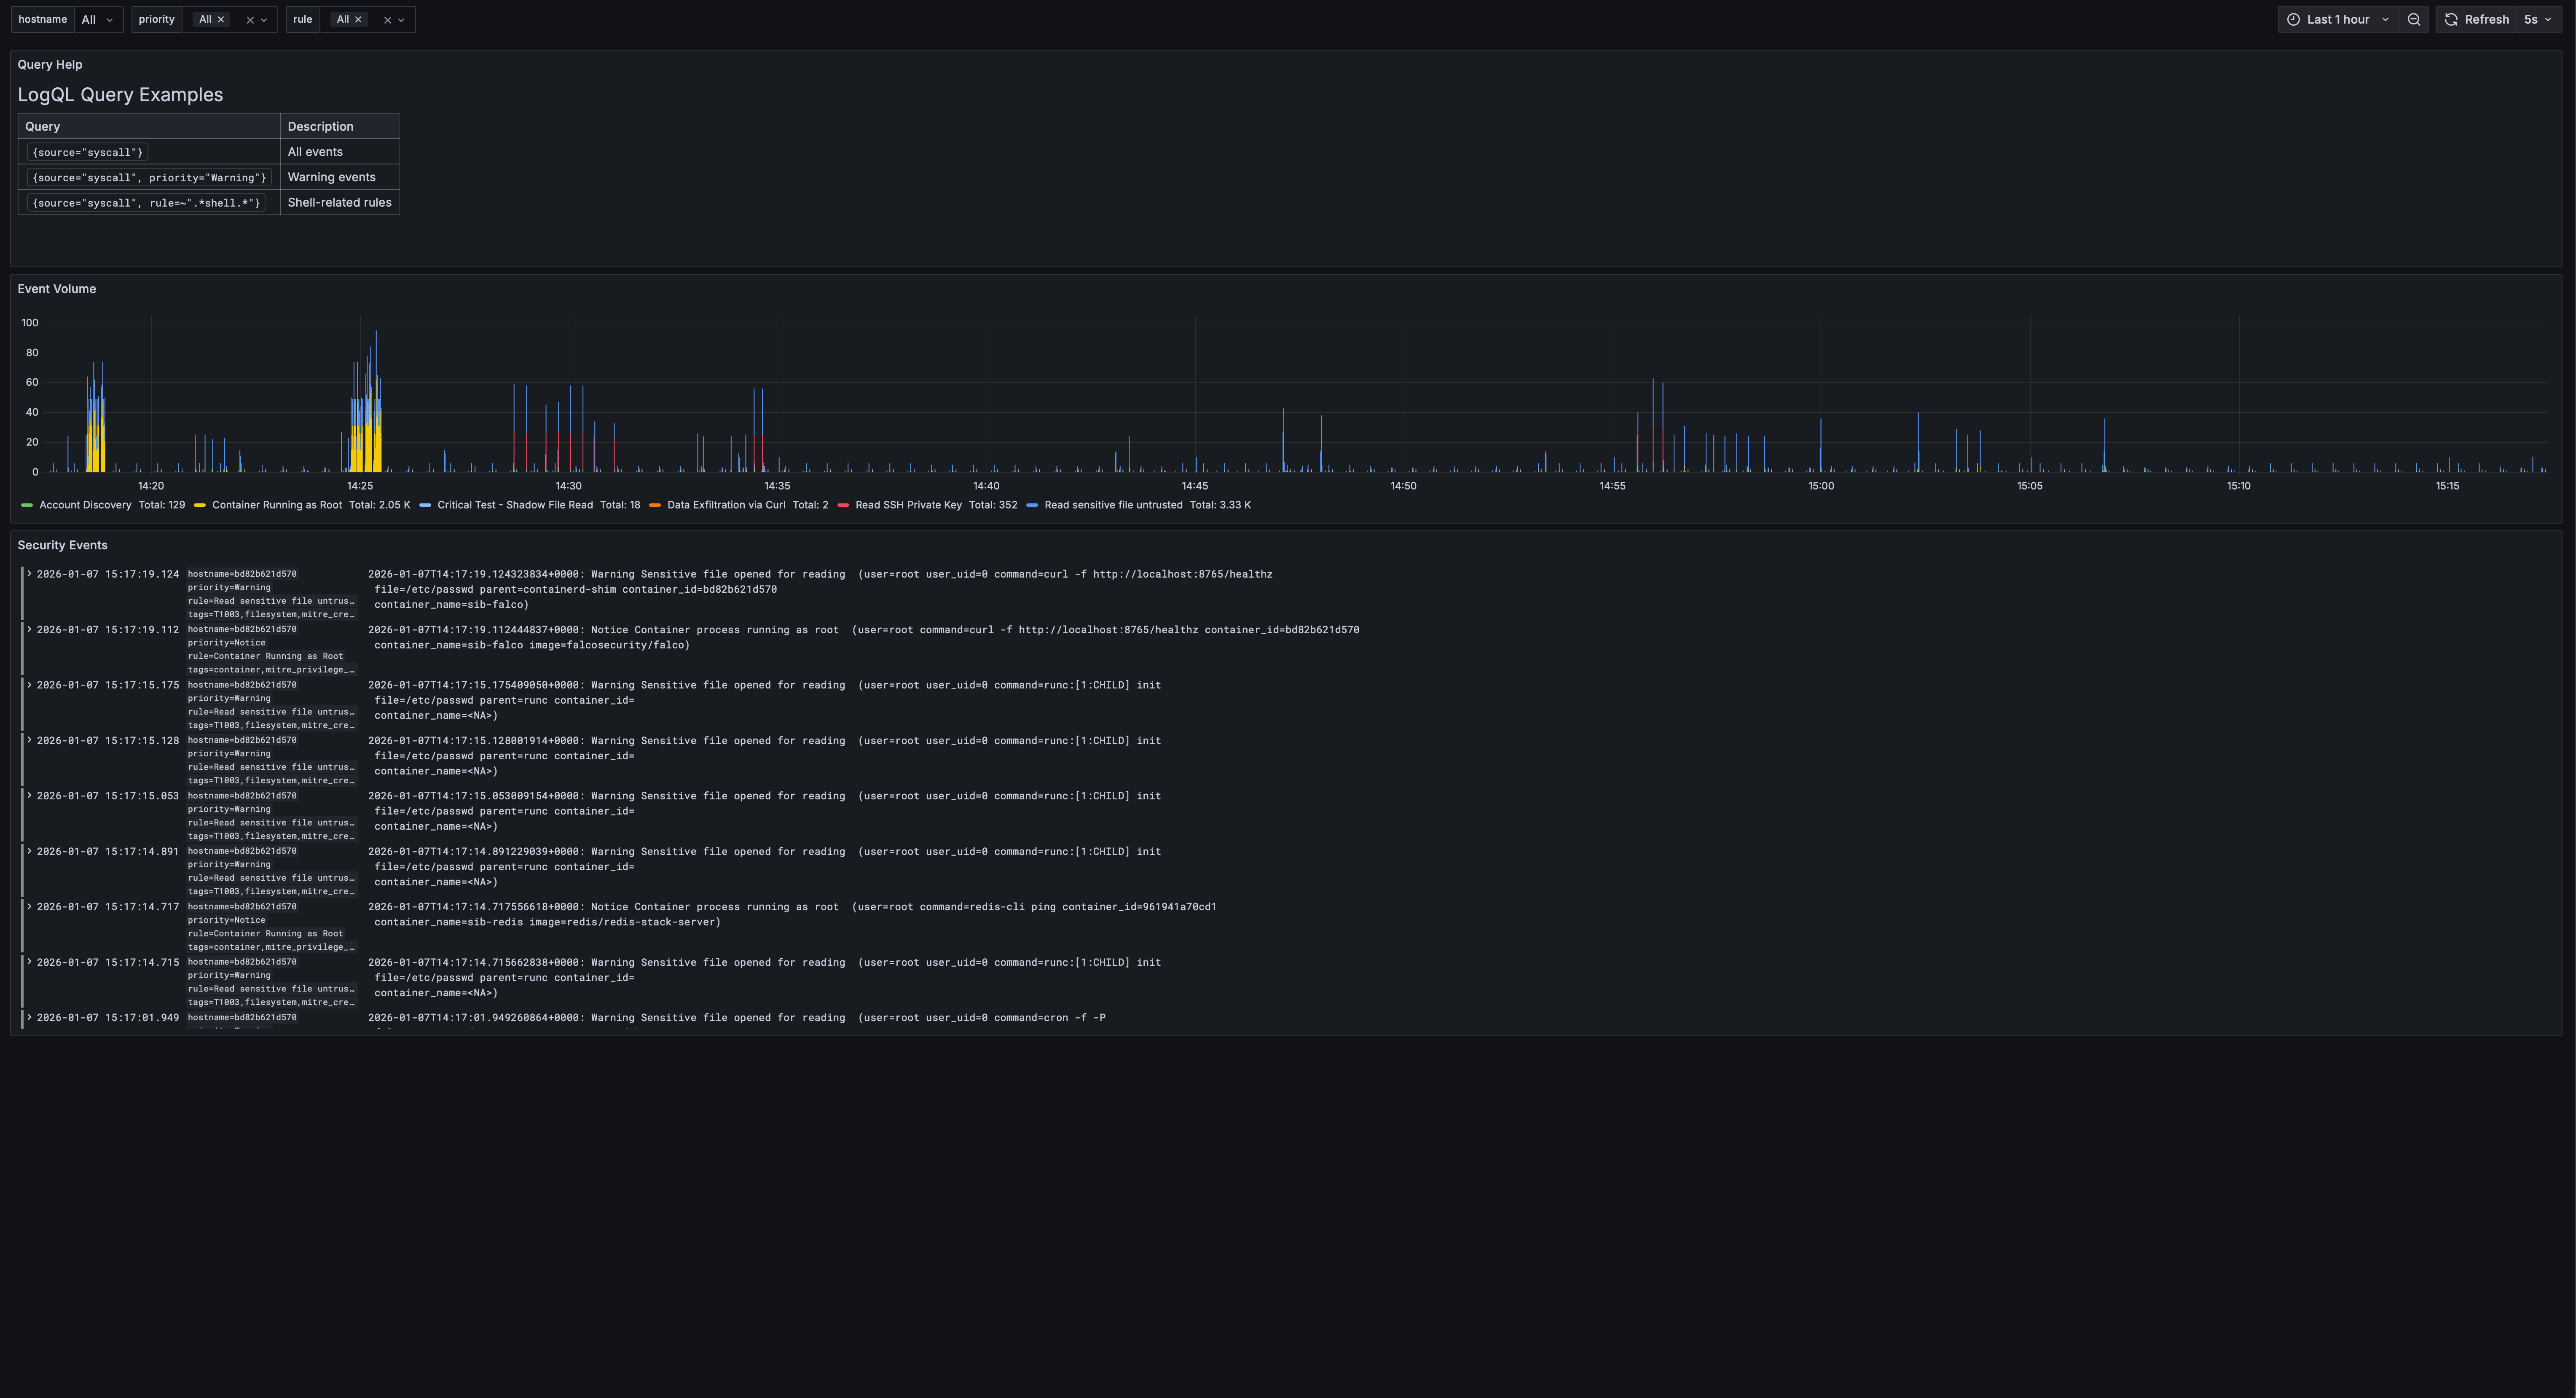
Features:
- Query help with LogQL examples
- Event volume by rule
- Filterable log view with priority and rule filters
MITRE ATT&CK Coverage
Navigate to Dashboards → MITRE ATT&CK Coverage
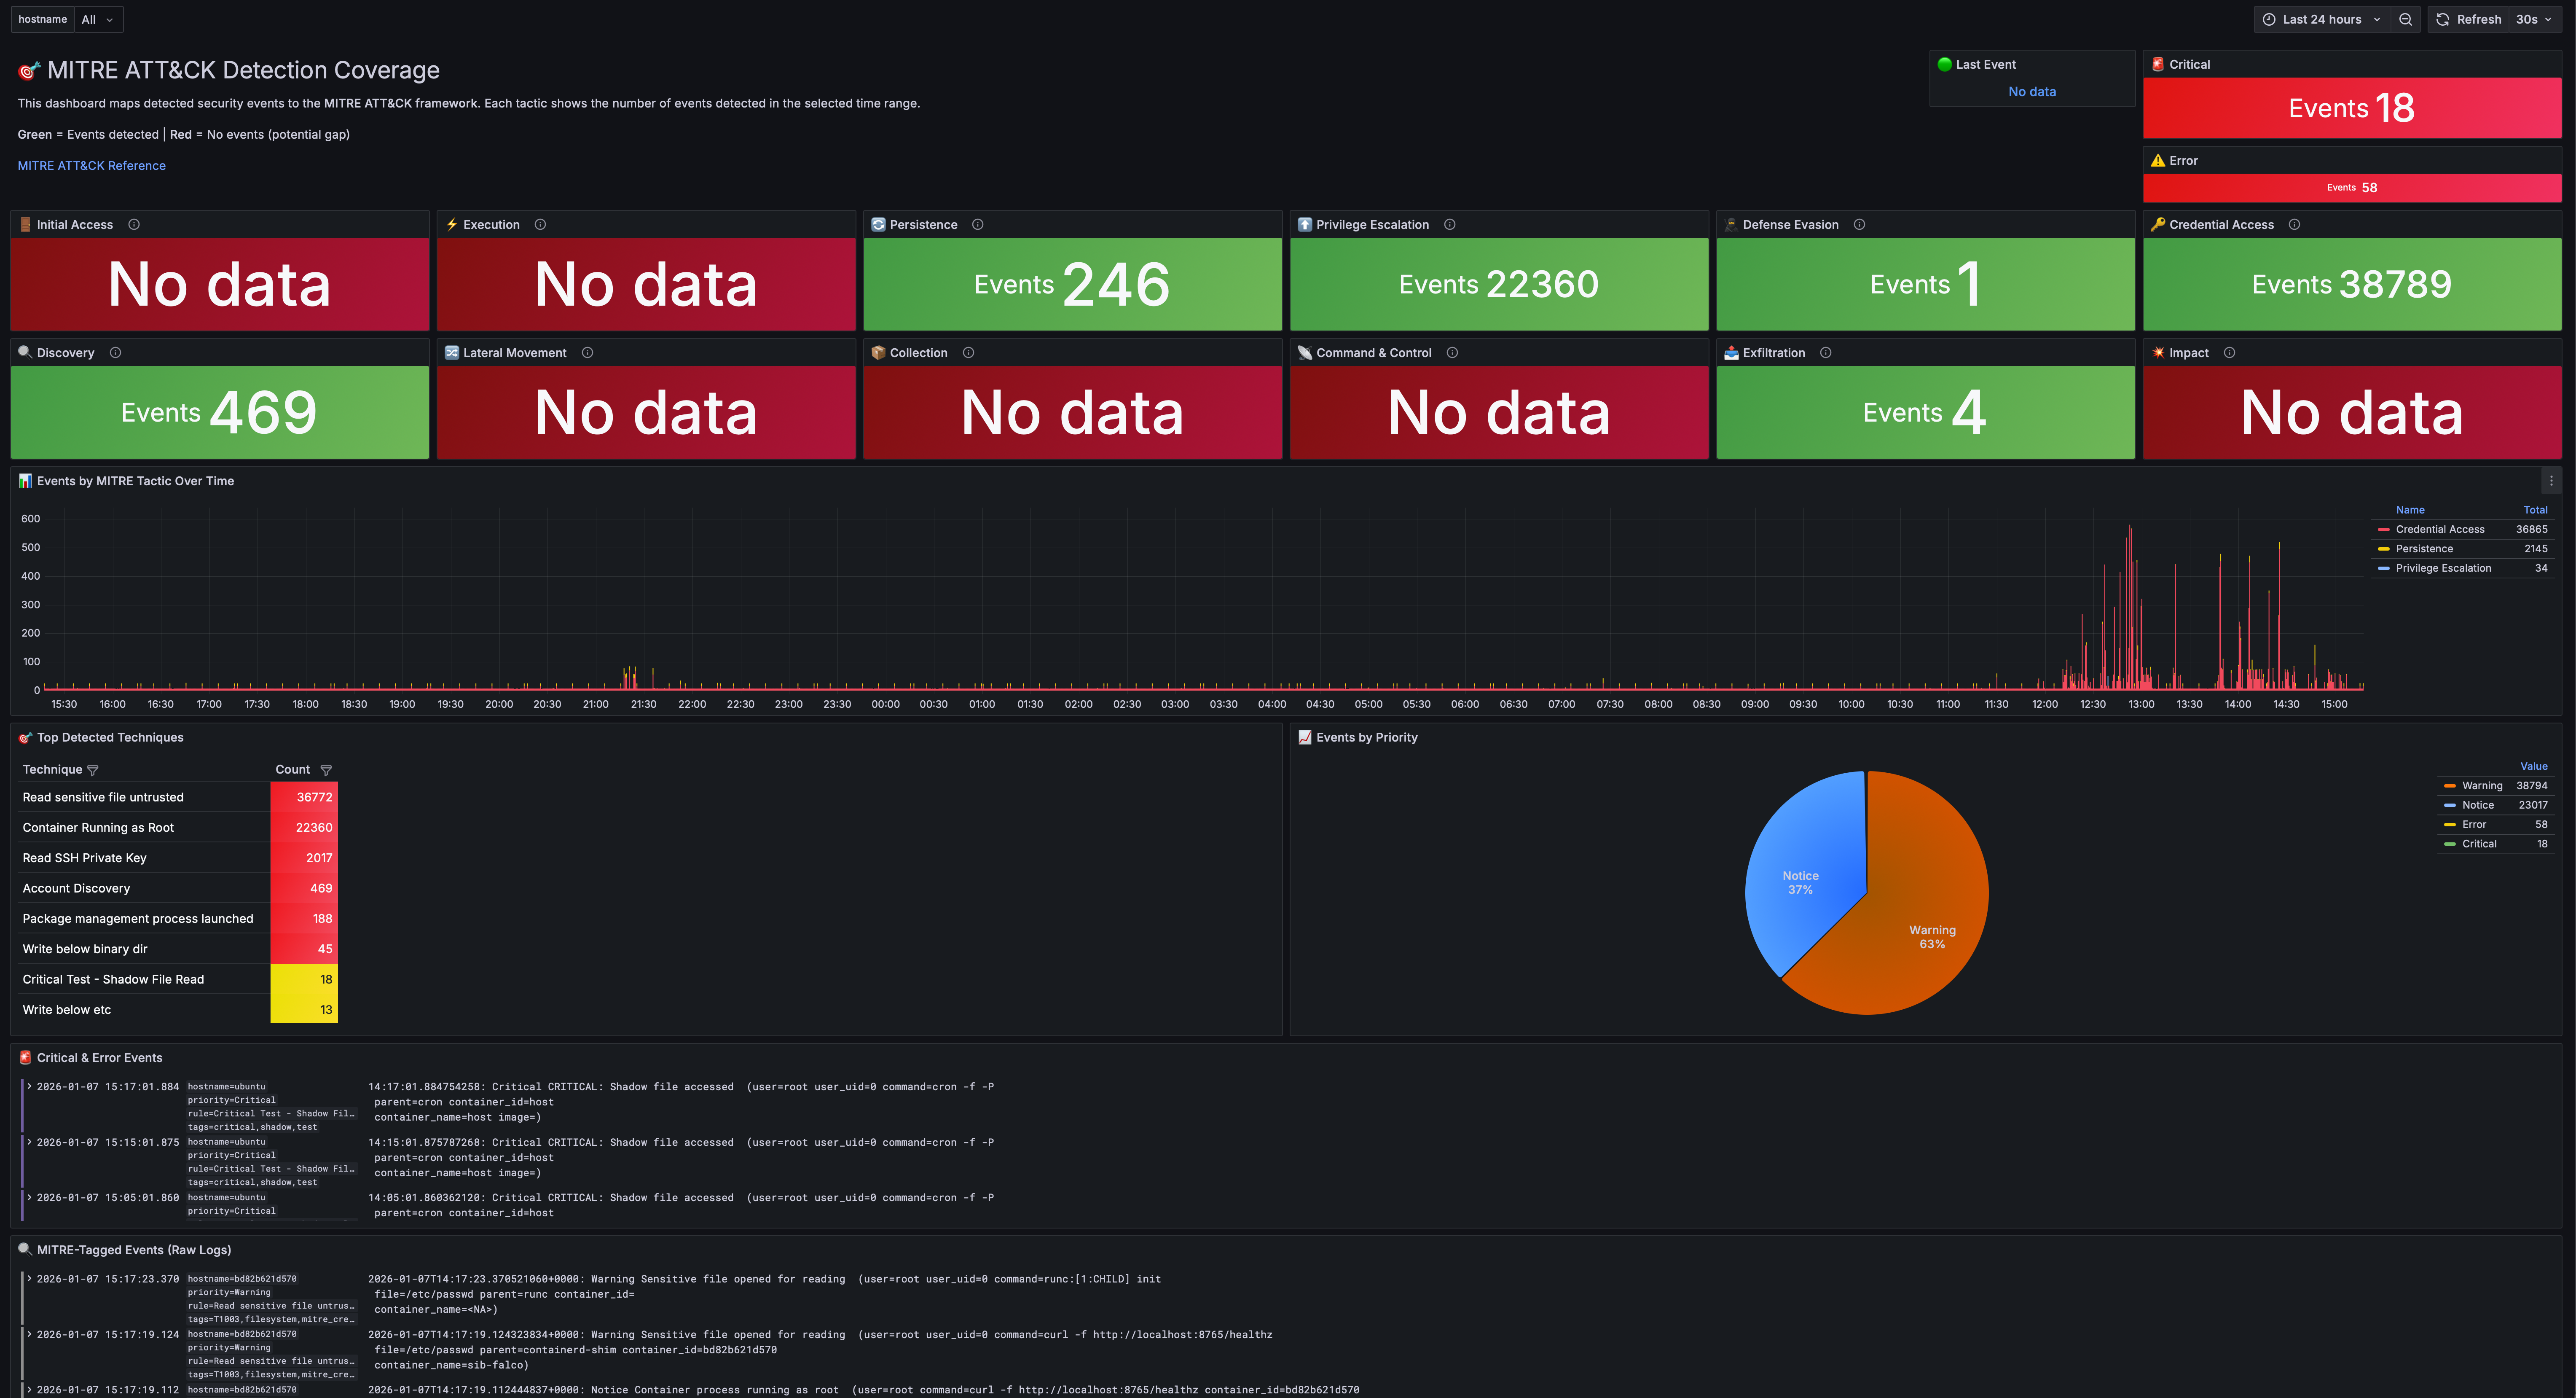
This dashboard maps all detections to the ATT&CK framework:
- 12 stat panels showing detection counts for each tactic
- Timeline view of events by tactic
- Technique breakdown table
- Priority distribution pie chart
Fleet Overview
Navigate to Dashboards → Fleet Overview
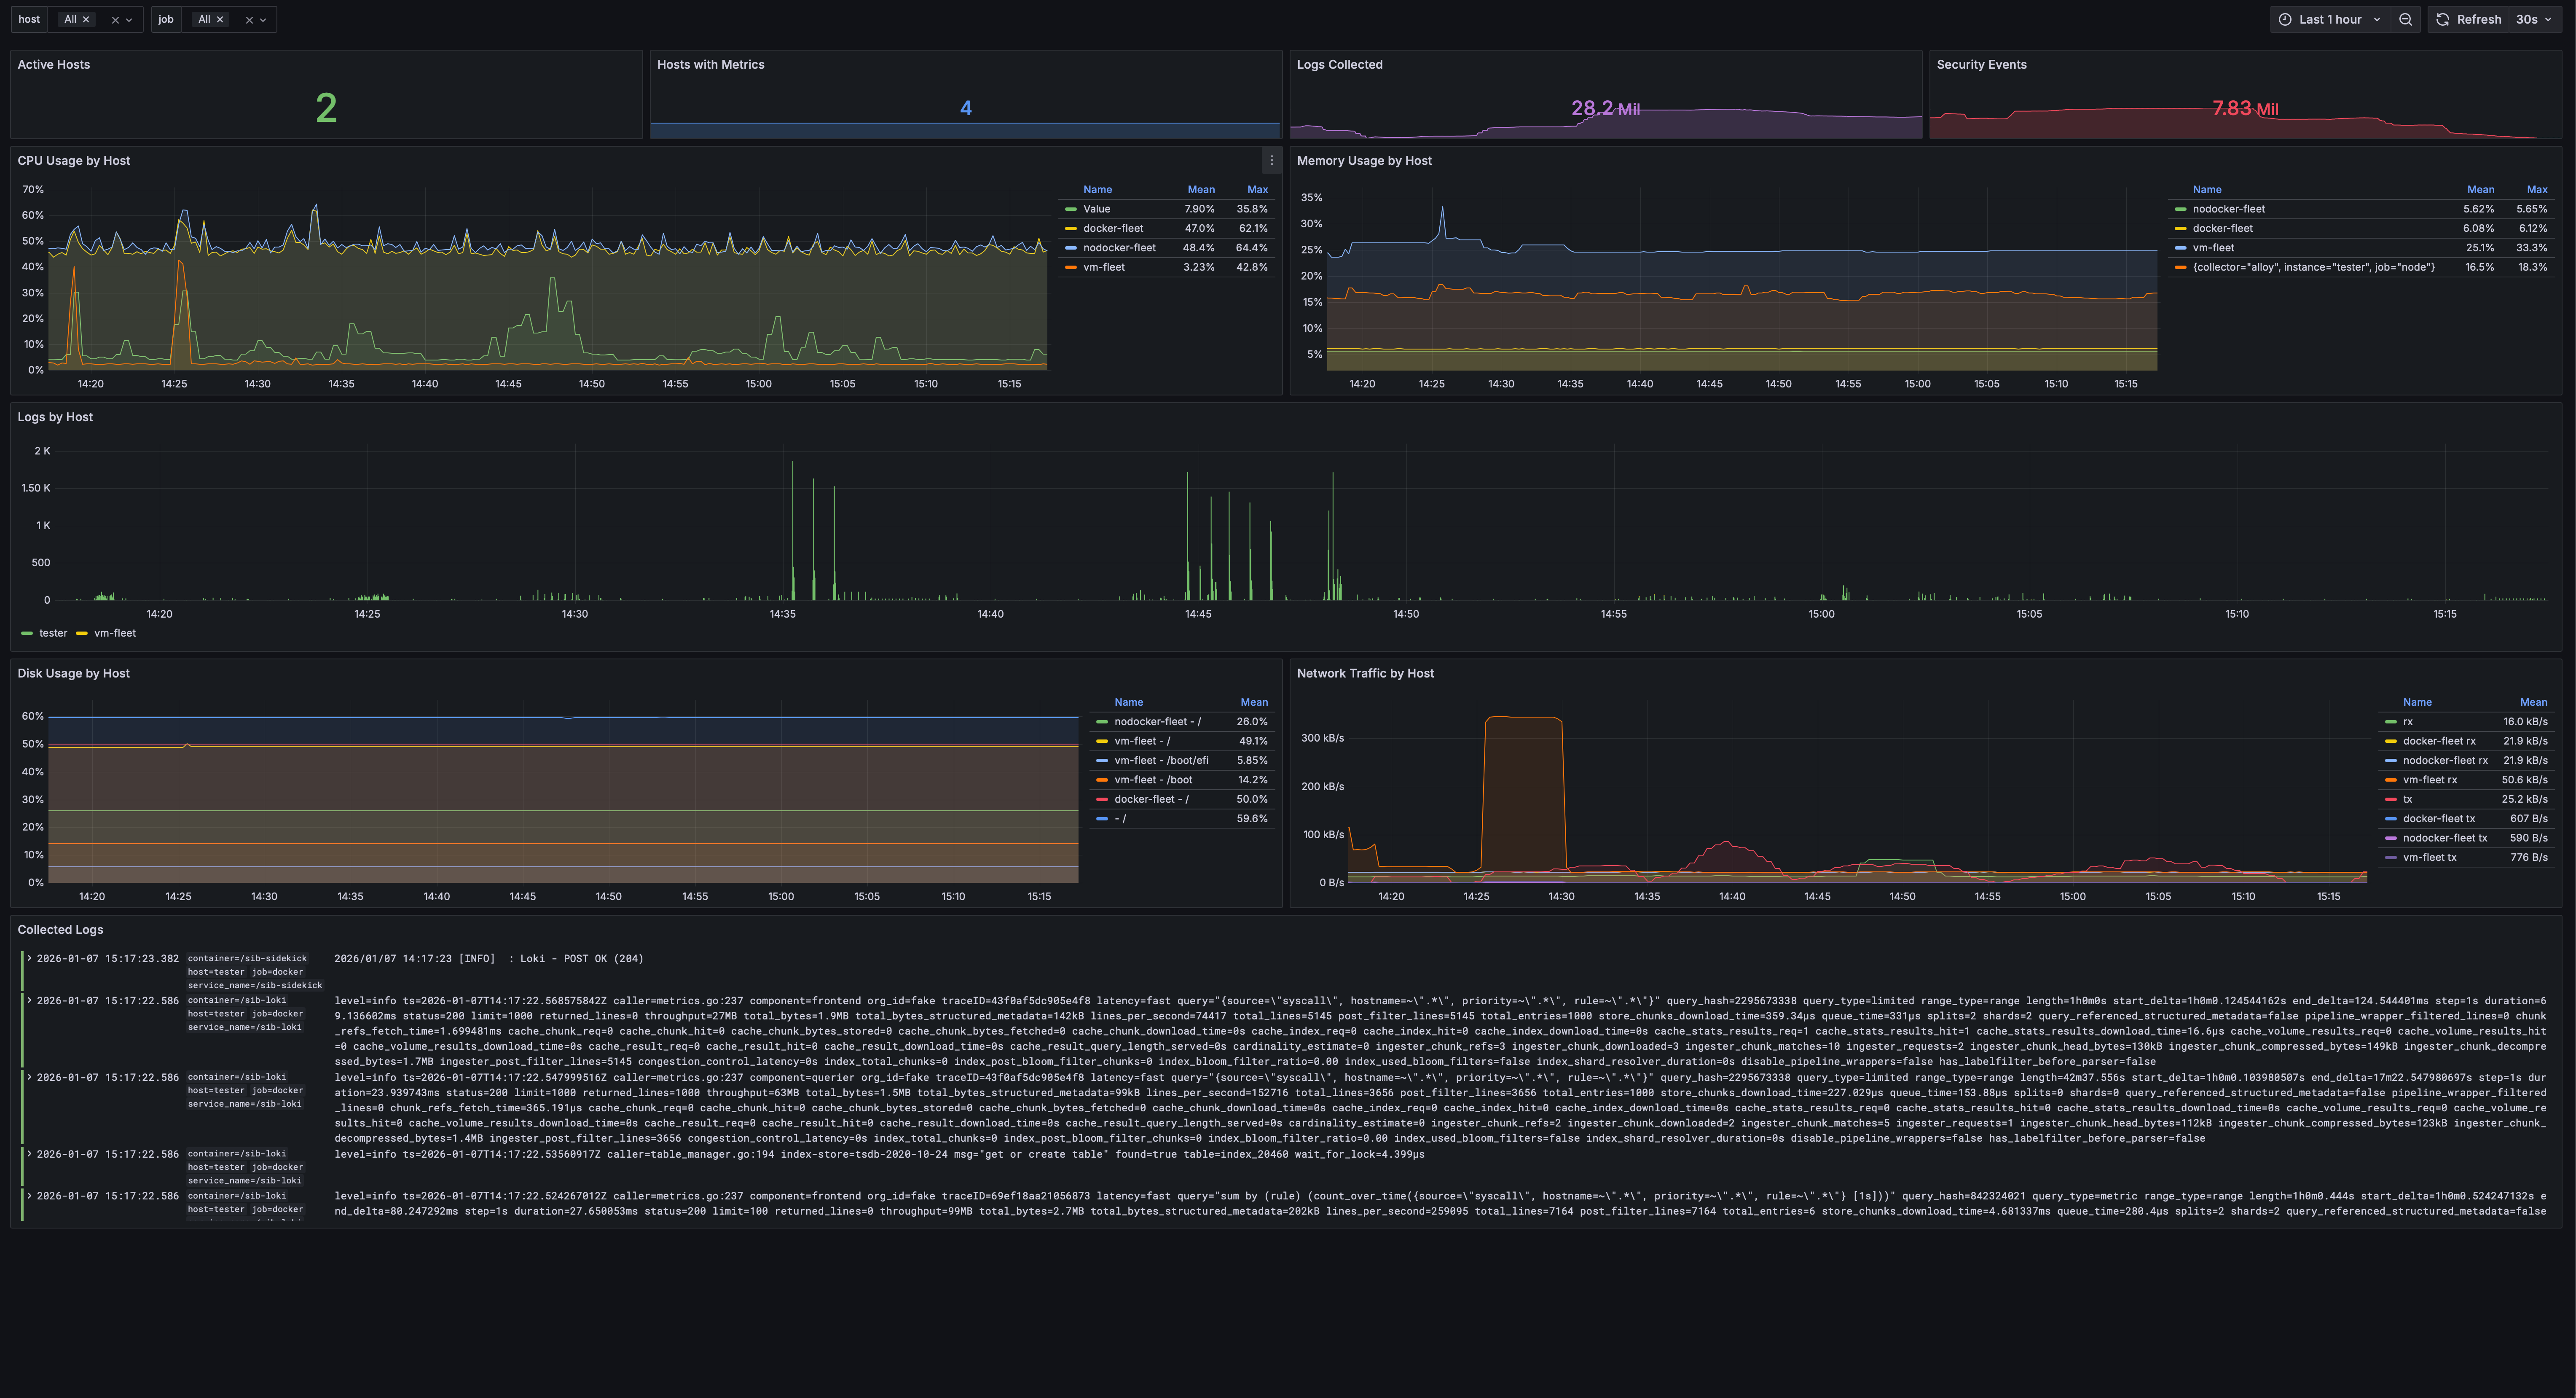
Monitor multiple hosts:
- Active hosts with collectors
- CPU, memory, disk usage per host
- Network traffic graphs
- Log volume by host
- Hostname selector to filter all panels
Verifying the Pipeline
Run the pipeline test to ensure everything is working:
./scripts/test-pipeline.sh
This script:
- Checks if all containers are running
- Generates a test event
- Verifies the event reaches VictoriaLogs
- Confirms Grafana can query the event
Expected output:
[✓] Falco is running
[✓] Falcosidekick is running
[✓] VictoriaLogs is running
[✓] Grafana is running
[✓] Test event generated
[✓] Event found in VictoriaLogs
[✓] Pipeline is working correctly!
Note: If you’re using the Grafana stack (
STACK=grafana), the output will show “Loki” instead of “VictoriaLogs”.
Common Commands
# Check status of all services
make status

# Quick health check
make health

# Diagnose common issues
make doctor

# View logs from all services
make logs

# View logs from specific service
make logs-falco
make logs-sidekick
make logs-storage
make logs-grafana

# Restart all services
make restart

# Stop all services
make stop

# Start all services
make start

# Open Grafana in browser
make open

# Show all endpoints
make info

# Backup & Restore
make backup               # Create timestamped backup of configs, rules, and dashboards
make restore              # Restore from a backup file
What Gets Detected?
Out of the box, SIB catches:
| Category | Examples |
|---|---|
| Credential Access | Reading /etc/shadow, SSH key access |
| Container Security | Shells in containers, privileged operations |
| File Integrity | Writes to /etc, sensitive config changes |
| Process Anomalies | Unexpected binaries, shell spawning |
| Persistence | Cron modifications, systemd changes |
| Cryptomining | Mining processes, pool connections |
| Defense Evasion | Log clearing, timestomping |
| Discovery | System enumeration, network scanning |
| Lateral Movement | SSH from containers, remote file copy |
| Exfiltration | Curl uploads, DNS tunneling indicators |
Next Steps
Now that you’ve seen SIB in action:
- Add custom rules — See Custom Rules below
- Deploy to fleet — Fleet Management
- Enable AI analysis — AI Analysis
- Update threat intel — Run
make update-threatintel
Custom Rules
Add your own detection rules in detection/config/rules/custom_rules.yaml:
- rule: Detect Cryptocurrency Mining
  desc: Detect cryptocurrency mining processes
  condition: >
    spawned_process and
    proc.name in (xmrig, minerd, cpuminer)
  output: "Crypto miner detected (user=%user.name cmd=%proc.cmdline)"
  priority: CRITICAL
  tags: [cryptomining, mitre_impact]
After adding rules:
make restart
Configuring Alert Outputs
Send alerts to Slack, PagerDuty, and more. Edit alerting/config/config.yaml:
slack:
  webhookurl: "https://hooks.slack.com/services/XXX/YYY/ZZZ"
  minimumpriority: "warning"

pagerduty:
  routingkey: "your-routing-key"
  minimumpriority: "critical"
Falcosidekick supports 50+ outputs. See the Falcosidekick documentation for all options.
| ← Back to Home | Fleet Management → |