AI-Powered Alert Analysis
Analyze security events using LLMs — directly from Grafana.
⚠️ BETA: This feature is in active development. APIs and configuration may change.
Overview
Got an alert but not sure what it means? SIB can analyze your security events using Large Language Models to provide:
- Attack Vector Identification — What the attacker is trying to do
- MITRE ATT&CK Mapping — Tactic and technique IDs
- Risk Assessment — Severity, confidence, impact
- Mitigation Strategies — Immediate, short-term, long-term actions
- False Positive Assessment — Is this real or noise?
Quick Start
# Install the AI Analysis service
make install-analysis
You’ll be prompted for your server’s IP/hostname (so Grafana can link to the API). Then:
- Open Events Explorer dashboard in Grafana
- Click any event row to select it
- Click 🤖 Analyze with AI in the bottom panel
Privacy-First Design
Your sensitive data never leaves your network (unless you want it to). Before sending anything to the LLM, data is obfuscated:
| Data Type | What Happens |
|---|---|
| IP addresses | → [INTERNAL-IP-1], [EXTERNAL-IP-1] |
| Usernames | → [USER-1] |
| Hostnames | → [HOST-1] |
| Container IDs | → [CONTAINER-1] |
| Secrets | → [REDACTED] |
Preview Obfuscation
Use dry-run mode to see what gets sent:
curl "http://localhost:5000/analyze?rule=SomeRule&output=test&dry_run=true"
LLM Providers
| Provider | Where data goes | Best for |
|---|---|---|
| Ollama (default) | Your machine | Privacy-conscious users |
| OpenAI | OpenAI API | Better quality |
| Anthropic | Anthropic API | Claude fans |
Ollama Setup (Recommended)
# Install Ollama
curl -fsSL https://ollama.com/install.sh | sh

# Pull a model
ollama pull llama3.1:8b

# Verify it's running
ollama list
OpenAI Setup
Set your API key in analysis/config.yaml:
llm:
  provider: openai
  model: gpt-4
  api_key: sk-your-key-here
Or via environment variable:
export OPENAI_API_KEY=sk-your-key-here
Anthropic Setup
llm:
  provider: anthropic
  model: claude-3-sonnet-20240229
  api_key: your-key-here
Configuration
Edit analysis/config.yaml:
# LLM Provider settings
llm:
  provider: ollama  # ollama, openai, or anthropic
  model: llama3.1:8b
  base_url: http://host.docker.internal:11434  # For Ollama

# Obfuscation settings
obfuscation:
  enabled: true
  preserve_structure: true

# Cache settings
cache:
  enabled: true
  ttl: 3600  # seconds

# Storage backend (auto-detected from STACK env var)
# STACK=vm → queries VictoriaLogs
# STACK=grafana (or unset) → queries Loki

# Server settings
server:
  host: 0.0.0.0
  port: 5000
Cache Deduplication
- Cache entries expire after
ANALYSIS_CACHE_TTLseconds (default: 24 hours, configurable via env var) - Cache keys are normalized — timestamps, numeric IDs, IPs, and container IDs are stripped so similar alerts share a single cache entry
- Duplicate requests increment a
dedup_countcounter rather than re-running analysis
Storage Backend
The analyzer auto-detects the storage backend from the STACK environment variable:
STACK value |
Backend |
|---|---|
vm |
VictoriaLogs |
grafana (or unset) |
Loki |
No additional configuration is needed — set STACK in your .env file and the analysis service will query the correct backend.
Docker Secrets
API keys can be loaded from Docker secrets instead of environment variables. Use the _FILE suffix to point to a secret file:
ANTHROPIC_API_KEY_FILE=/run/secrets/anthropic_key
OPENAI_API_KEY_FILE=/run/secrets/openai_key
When a _FILE variant is set, the service reads the key from that file at startup. This avoids storing secrets in .env or config.yaml.
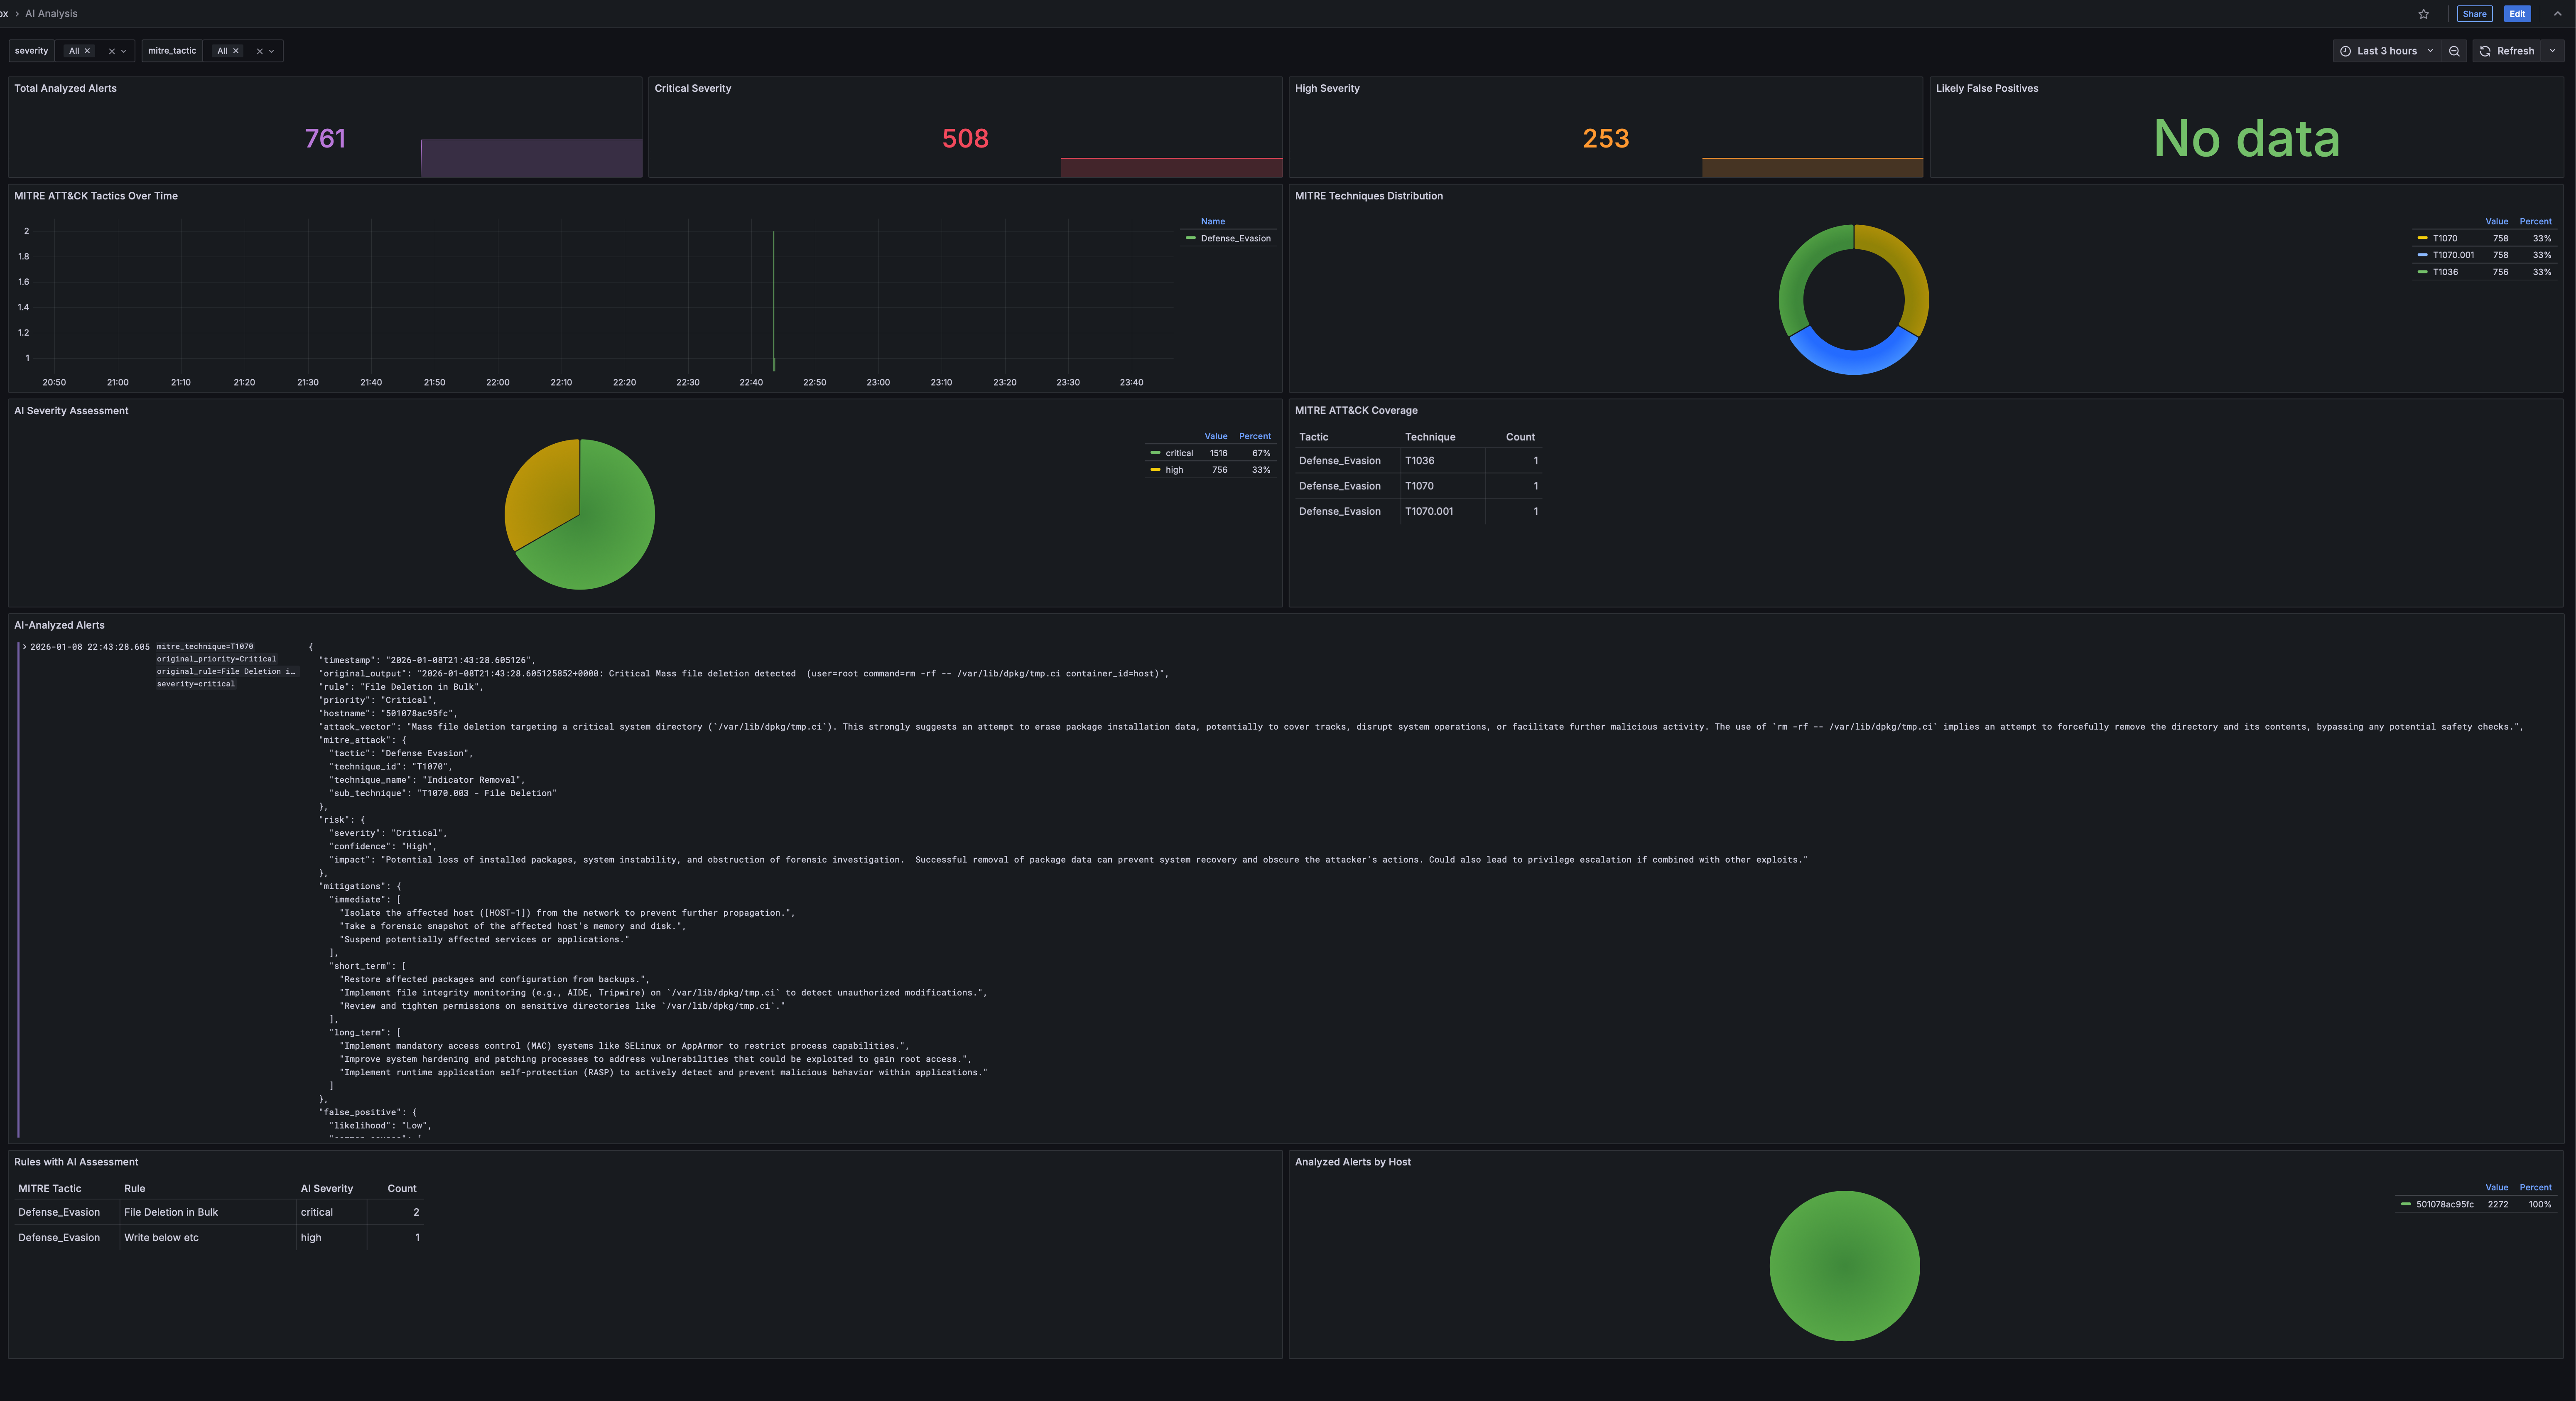
Grafana Integration
After installation, the Events Explorer dashboard gets a dedicated AI analysis tab:
Workflow
- Browse events in the Events Explorer
- Click a row to select an event
- The bottom panel shows event details and an “Analyze with AI” link
- Click to get instant AI-powered analysis in a new tab
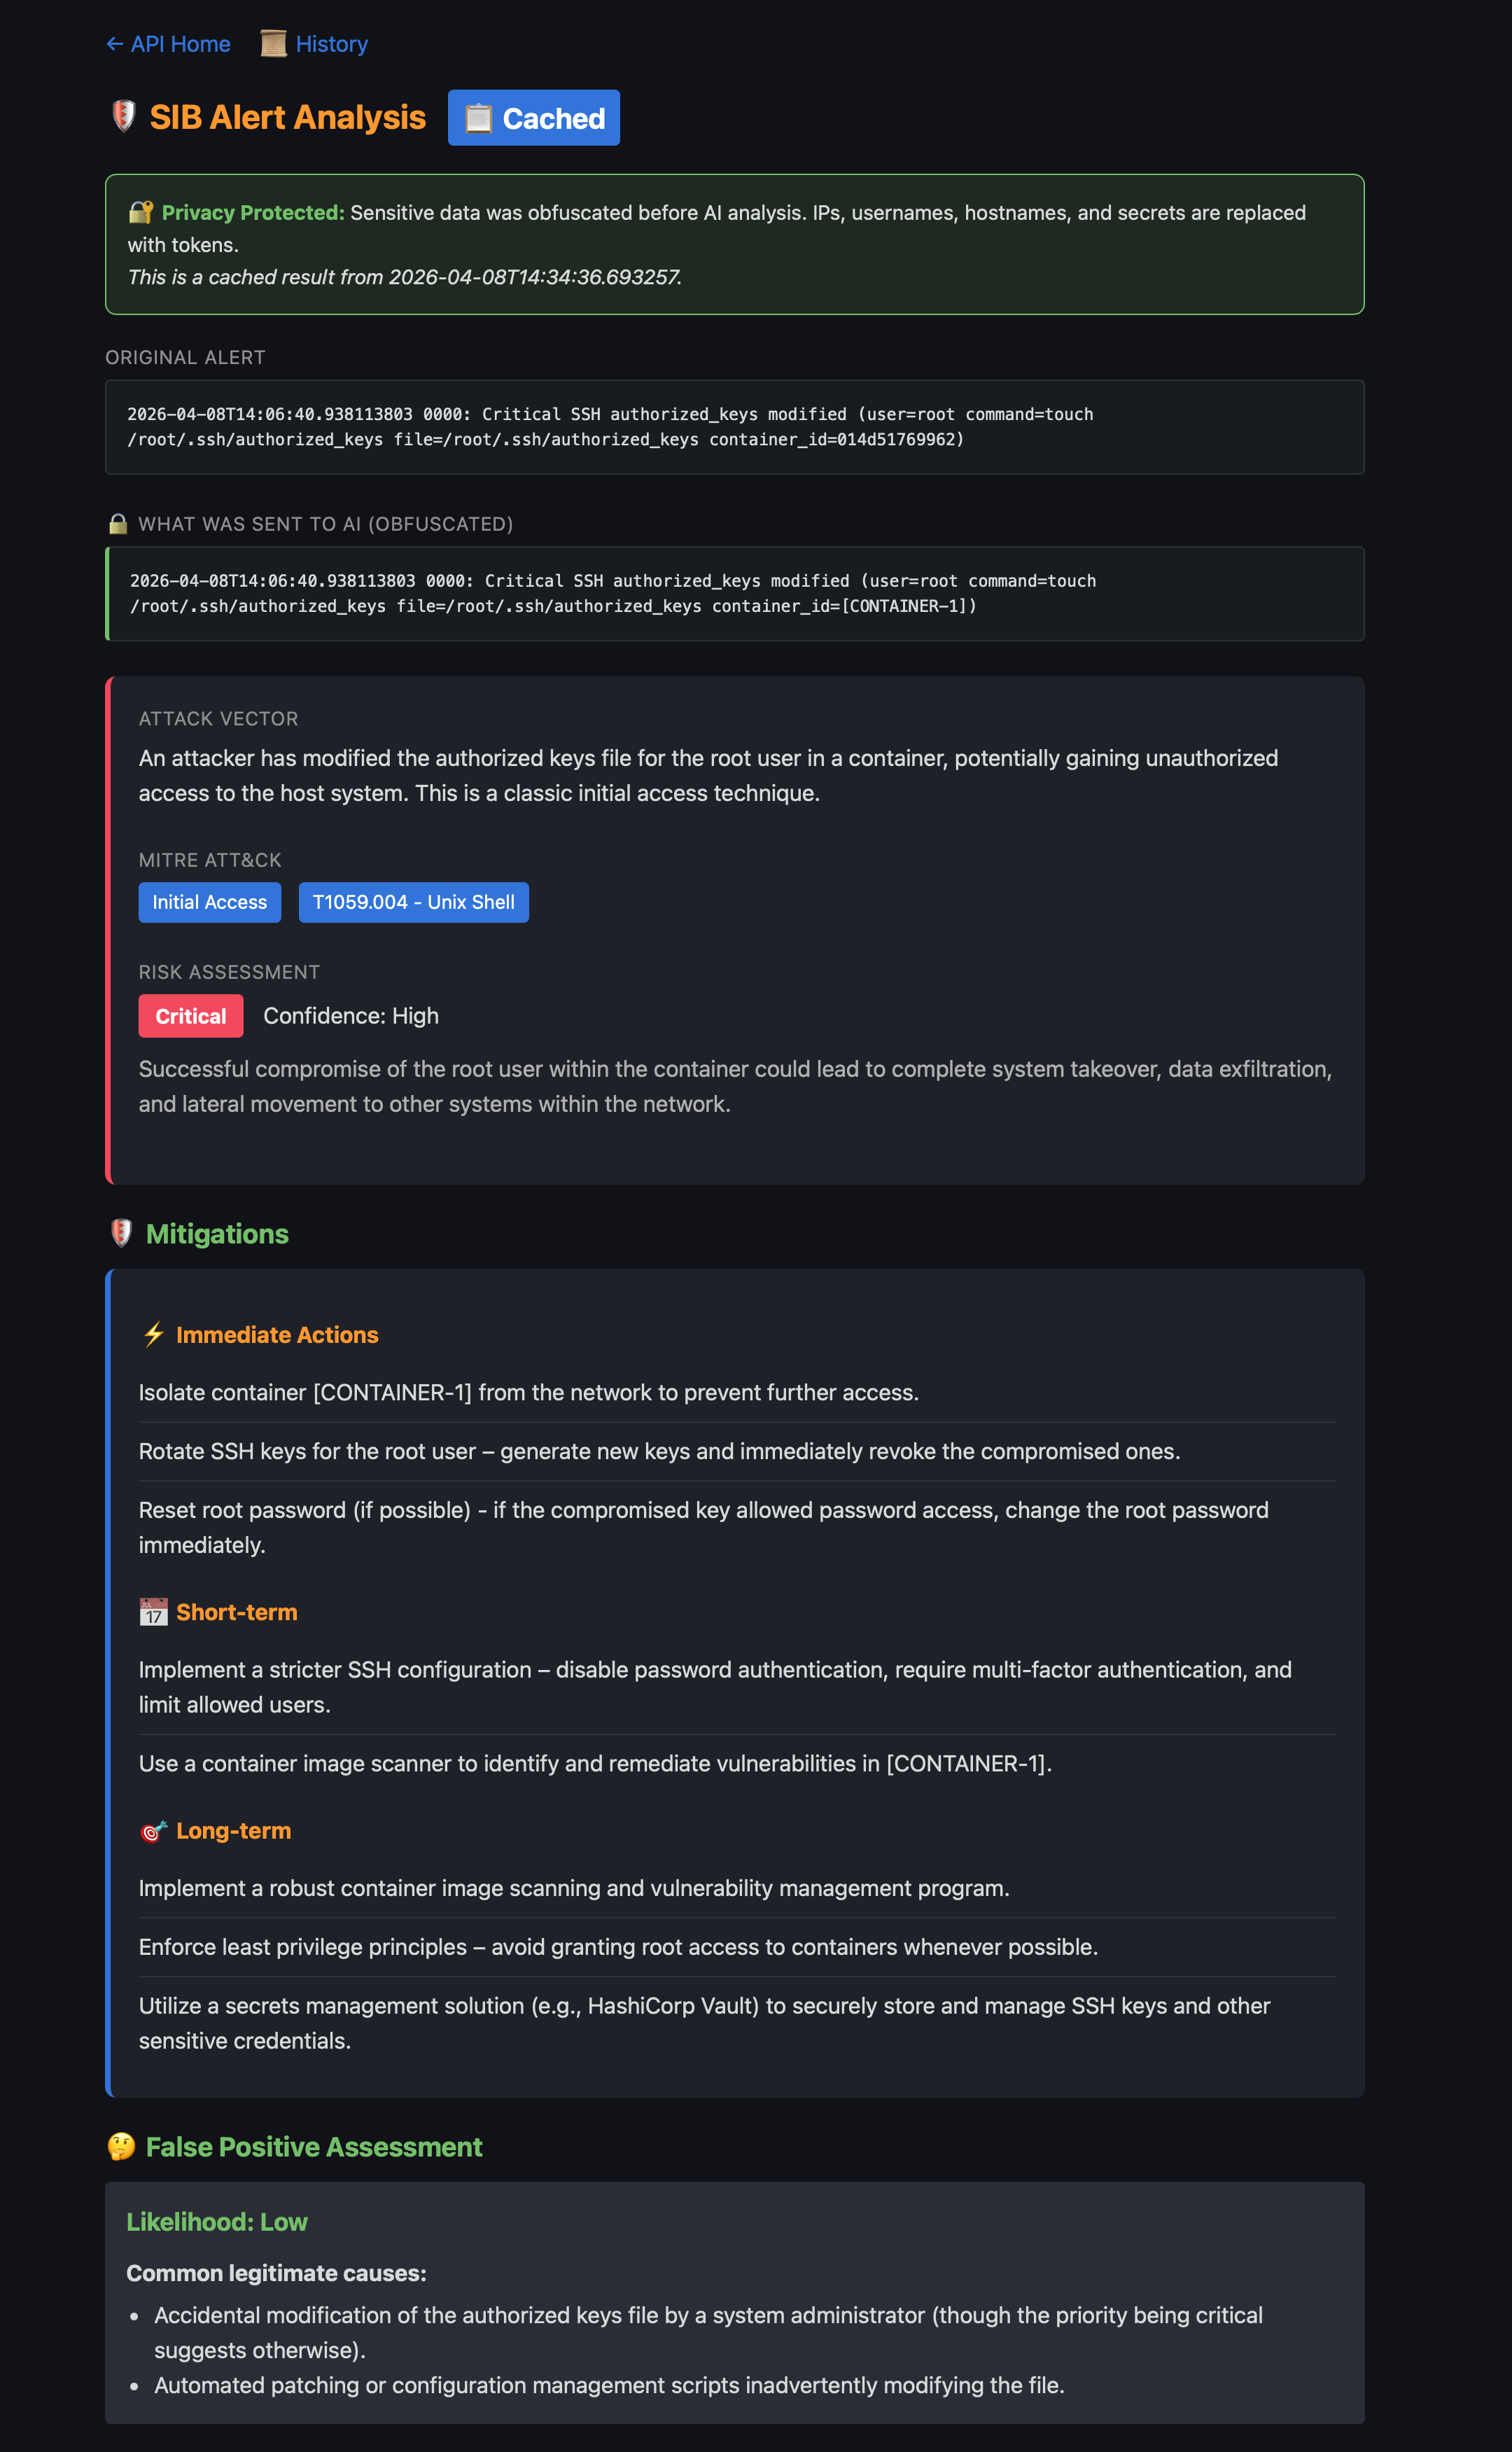
Analysis Results
Each analysis shows the original alert alongside the obfuscated version sent to the AI, with full attack context:
Analysis API
The API home page lists all endpoints and shows cached analysis count:
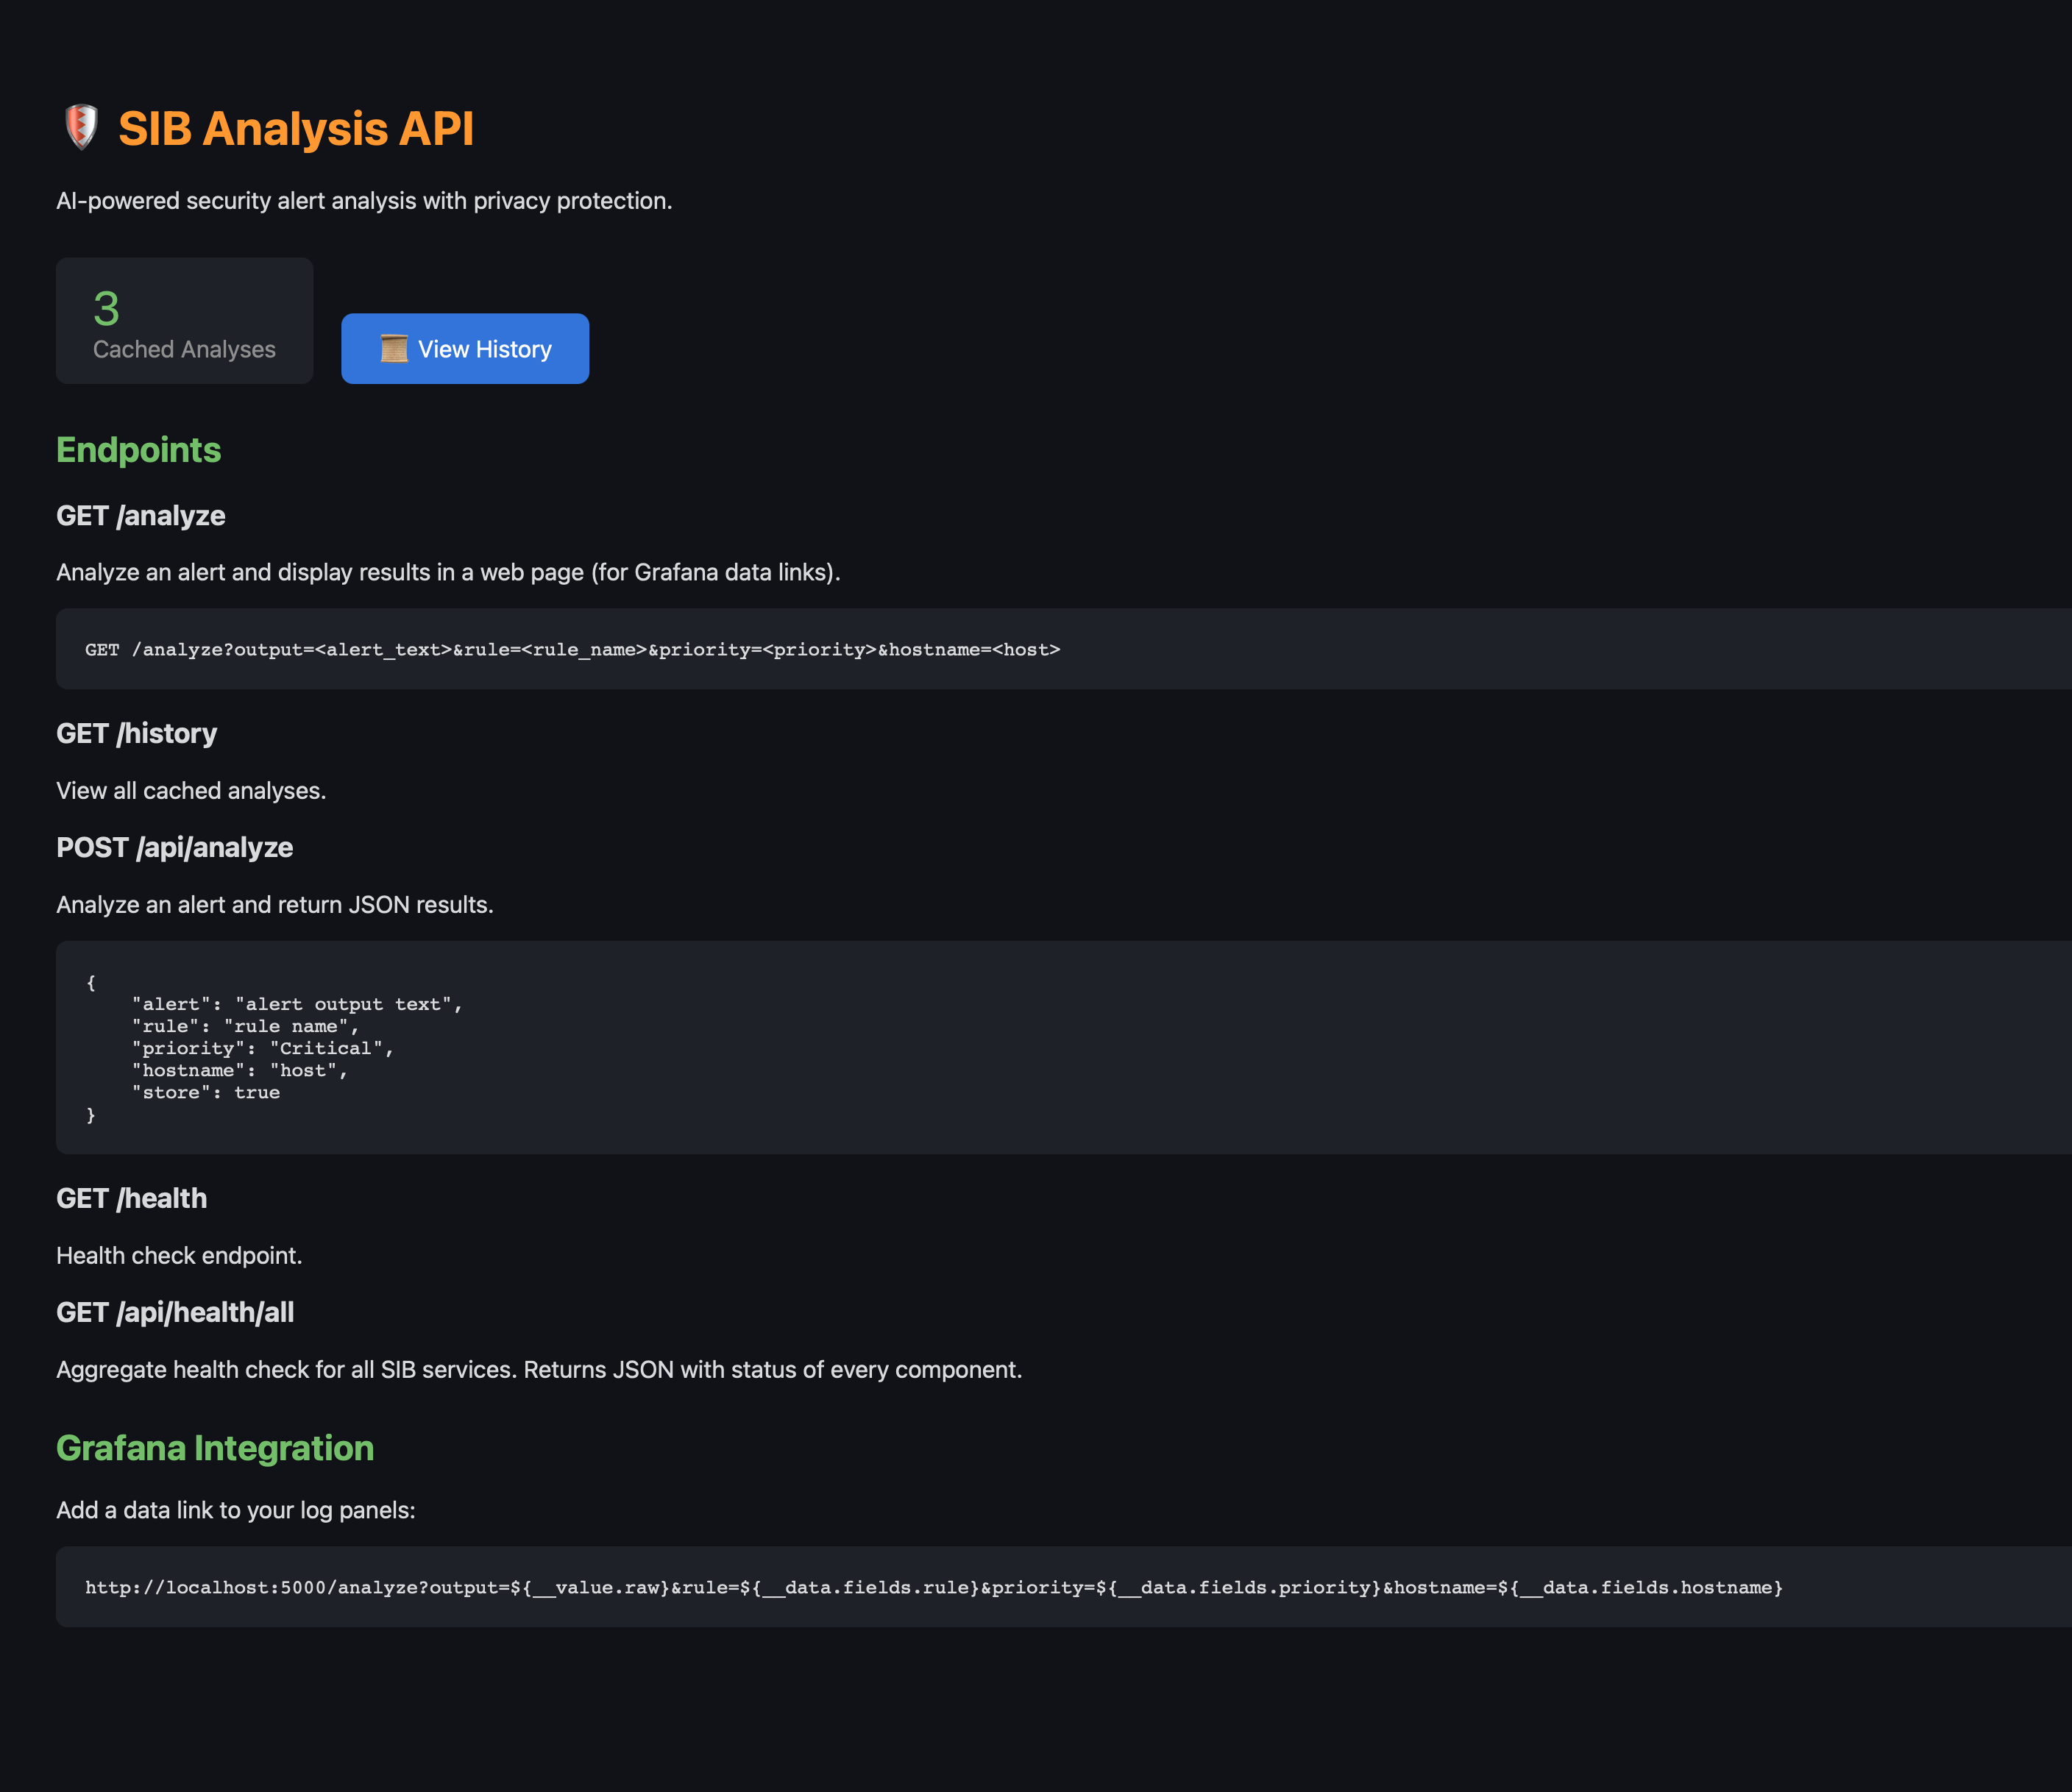
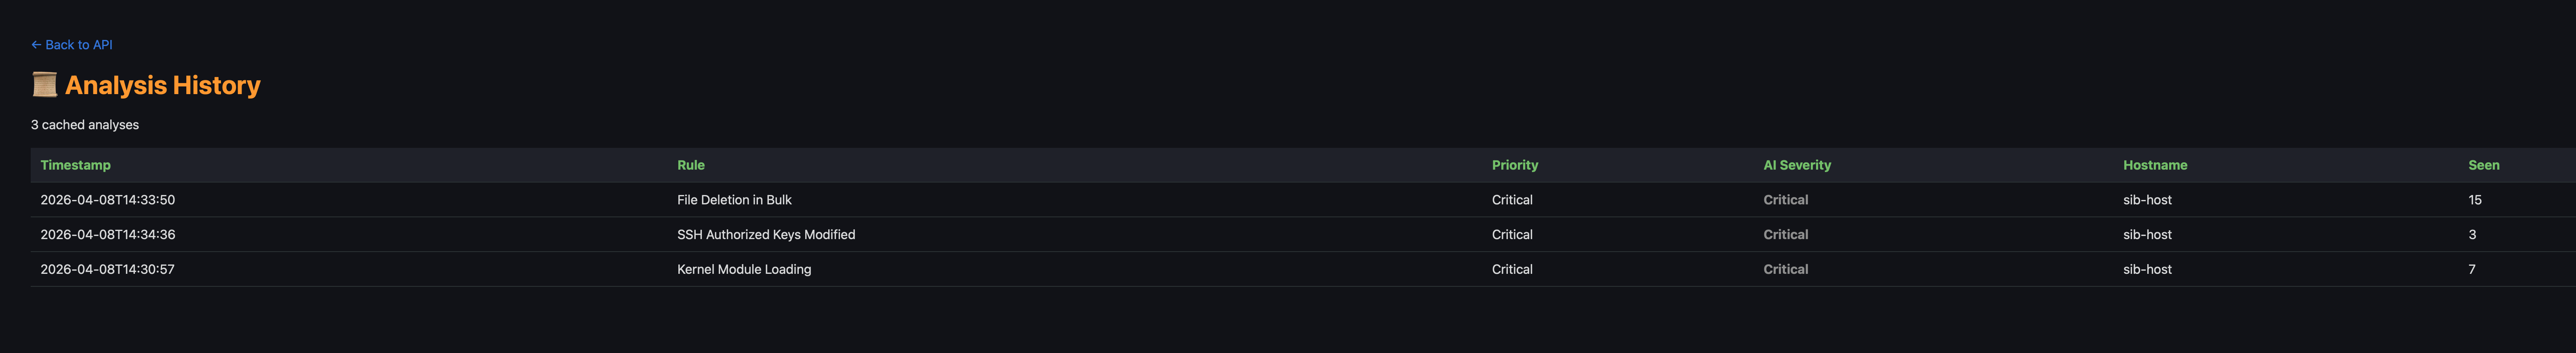
Browse all past analyses from the history view:
Supported Dashboards
All log panels show the “🤖 Analyze with AI” link:
- Security Overview — Critical Events, Recent Events panels
- Events Explorer — All log entries
- MITRE ATT&CK — Critical & Error Events, MITRE-Tagged Events
Example Analysis Output
======================================================================
🔍 SECURITY ALERT ANALYSIS
======================================================================

🎯 Attack Vector:
   An attacker is attempting to modify system configuration files,
   specifically the dynamic linker cache, likely to inject malicious
   code or redirect program execution to a compromised library.

📊 MITRE ATT&CK:
   Tactic: Persistence
   Technique: T1547.001 - Boot or Logon Autostart Execution

⚠️  Risk Assessment:
   Severity: 🔴 Critical
   Confidence: High
   Impact: Complete system compromise, ability to execute arbitrary
   code with root privileges.

🛡️  Mitigations:
   Immediate:
     • Isolate the affected system from the network
     • Quarantine /etc/ld.so.cache~ and restore from backup
   Short-term:
     • Rebuild the affected system from a clean image
   Long-term:
     • Implement file integrity monitoring (FIM)
     • Implement Mandatory Access Control (SELinux or AppArmor)

🤔 False Positive Assessment:
   Likelihood: Low

======================================================================
API Reference
Web Interface
GET /analyze?rule={rule}&output={output}&dry_run={true|false}
Returns a beautiful HTML page with analysis results.
JSON API
curl -X POST http://localhost:5000/api/analyze \
  -H "Content-Type: application/json" \
  -d '{
    "rule": "Write below etc",
    "output": "File below /etc created (user=root file=/etc/ld.so.cache~)",
    "priority": "Warning"
  }'
Response:
{
  "attack_vector": "...",
  "mitre_attack": {
    "tactic": "Persistence",
    "technique": "T1547.001",
    "technique_name": "Boot or Logon Autostart Execution"
  },
  "risk_assessment": {
    "severity": "critical",
    "confidence": "high",
    "impact": "..."
  },
  "mitigations": {
    "immediate": ["..."],
    "short_term": ["..."],
    "long_term": ["..."]
  },
  "false_positive": {
    "likelihood": "low",
    "common_causes": ["..."]
  }
}
Health Check
curl http://localhost:5000/health
Aggregated Health Check
curl http://localhost:5000/api/health/all
Returns JSON with health status of all SIB services (Falco, Falcosidekick, storage, Grafana, etc.).
Managing the Service
# Start the analysis service
make start-analysis

# Stop the service
make stop-analysis

# View logs
make logs-analysis

# Open shell in container
make shell-analysis

# Reinstall (after config changes)
make install-analysis
Troubleshooting
Analysis Returns Empty
Check Ollama is running:
curl http://localhost:11434/api/tags
Connection Refused
Ensure the analysis container can reach Ollama:
# If Ollama is on host, use host.docker.internal
# Check analysis/config.yaml base_url setting
Slow Analysis
- Use a smaller model (e.g.,
llama3.1:8binstead of larger variants) - Consider using OpenAI/Anthropic for faster responses
- Enable caching in config.yaml
API Key Issues
For OpenAI/Anthropic, ensure keys are set:
# Check if key is set
docker exec sib-analysis env | grep API_KEY

# Set in compose.yaml or config.yaml
Security Considerations
- Local LLM (Ollama): All data stays on your infrastructure
- Cloud LLMs: Data is obfuscated before sending, but some context may still be inferred
- API Exposure: The analysis API is bound to 0.0.0.0 by default. Use firewall rules to restrict access
- Caching: Cached results are stored in memory. Restart the container to clear cache
| ← Back to Home | ← Fleet Management |