I Built the Cloud Audit SIEM I Kept Wishing Existed
CAIB turns AWS, GCP, Azure, and Cloudflare audit logs into one self-hosted, testable detection system—and records the trade-offs instead of hiding them.
Cloud audit logs contain some of the best evidence in an incident and some of the least pleasant data to operate.
Every provider has a different delivery mechanism, event shape, pagination model, failure mode, and idea of what an actor or target should look like. Getting the logs is only the start. You still need to normalize them without throwing away the original event, detect hostile behavior, notice when collection silently stops, retain enough history to investigate, and prove that the whole thing survives a database failure and a restore.
The usual answers are either a pile of half-connected components or a managed SIEM bill large enough to become its own security event.
So I built Cloud Audit in a Box—CAIB: a self-hostable cloud and SaaS audit-log SIEM built from Vector, PostgreSQL 18 with TimescaleDB, Grafana, and small Python services packaged with Docker Compose.
Not a diagram. Not a Terraform module pointing at six paid services. A working release candidate with provisioned dashboards, detection rules, demo data, automated tests, measured performance, backup and restore drills, and an HA failure test that kills the primary while writes continue.
The important caveat comes early: the engineering build is complete, but real-cloud dogfooding is next. AWS, GCP, Azure, and Cloudflare paths are implemented and tested against synthetic fixtures; most still need live API verification with real tenant credentials. Calling that “production-proven” now would be marketing cosplay.
The question CAIB answers
CAIB is for the awkward middle ground.
You have enough cloud and SaaS activity that searching each provider separately is no longer credible. You want detections, retention, and analyst search. You do not want to surrender all audit evidence to a mandatory vendor cloud or spend the next quarter becoming the full-time operator of a general-purpose data platform.
The design goal became:
Clone it, run
make up, runmake demo, and reach populated dashboards with firing detections in under two minutes—without cloud credentials.
That demo path matters. A security tool should prove its data path before asking for production credentials. CAIB seeds thirty days of synthetic events across the shipped modules and fires sample detections. You can inspect the schema, dashboards, alert lifecycle, dead-letter handling, retention behavior, and query performance before connecting an account.
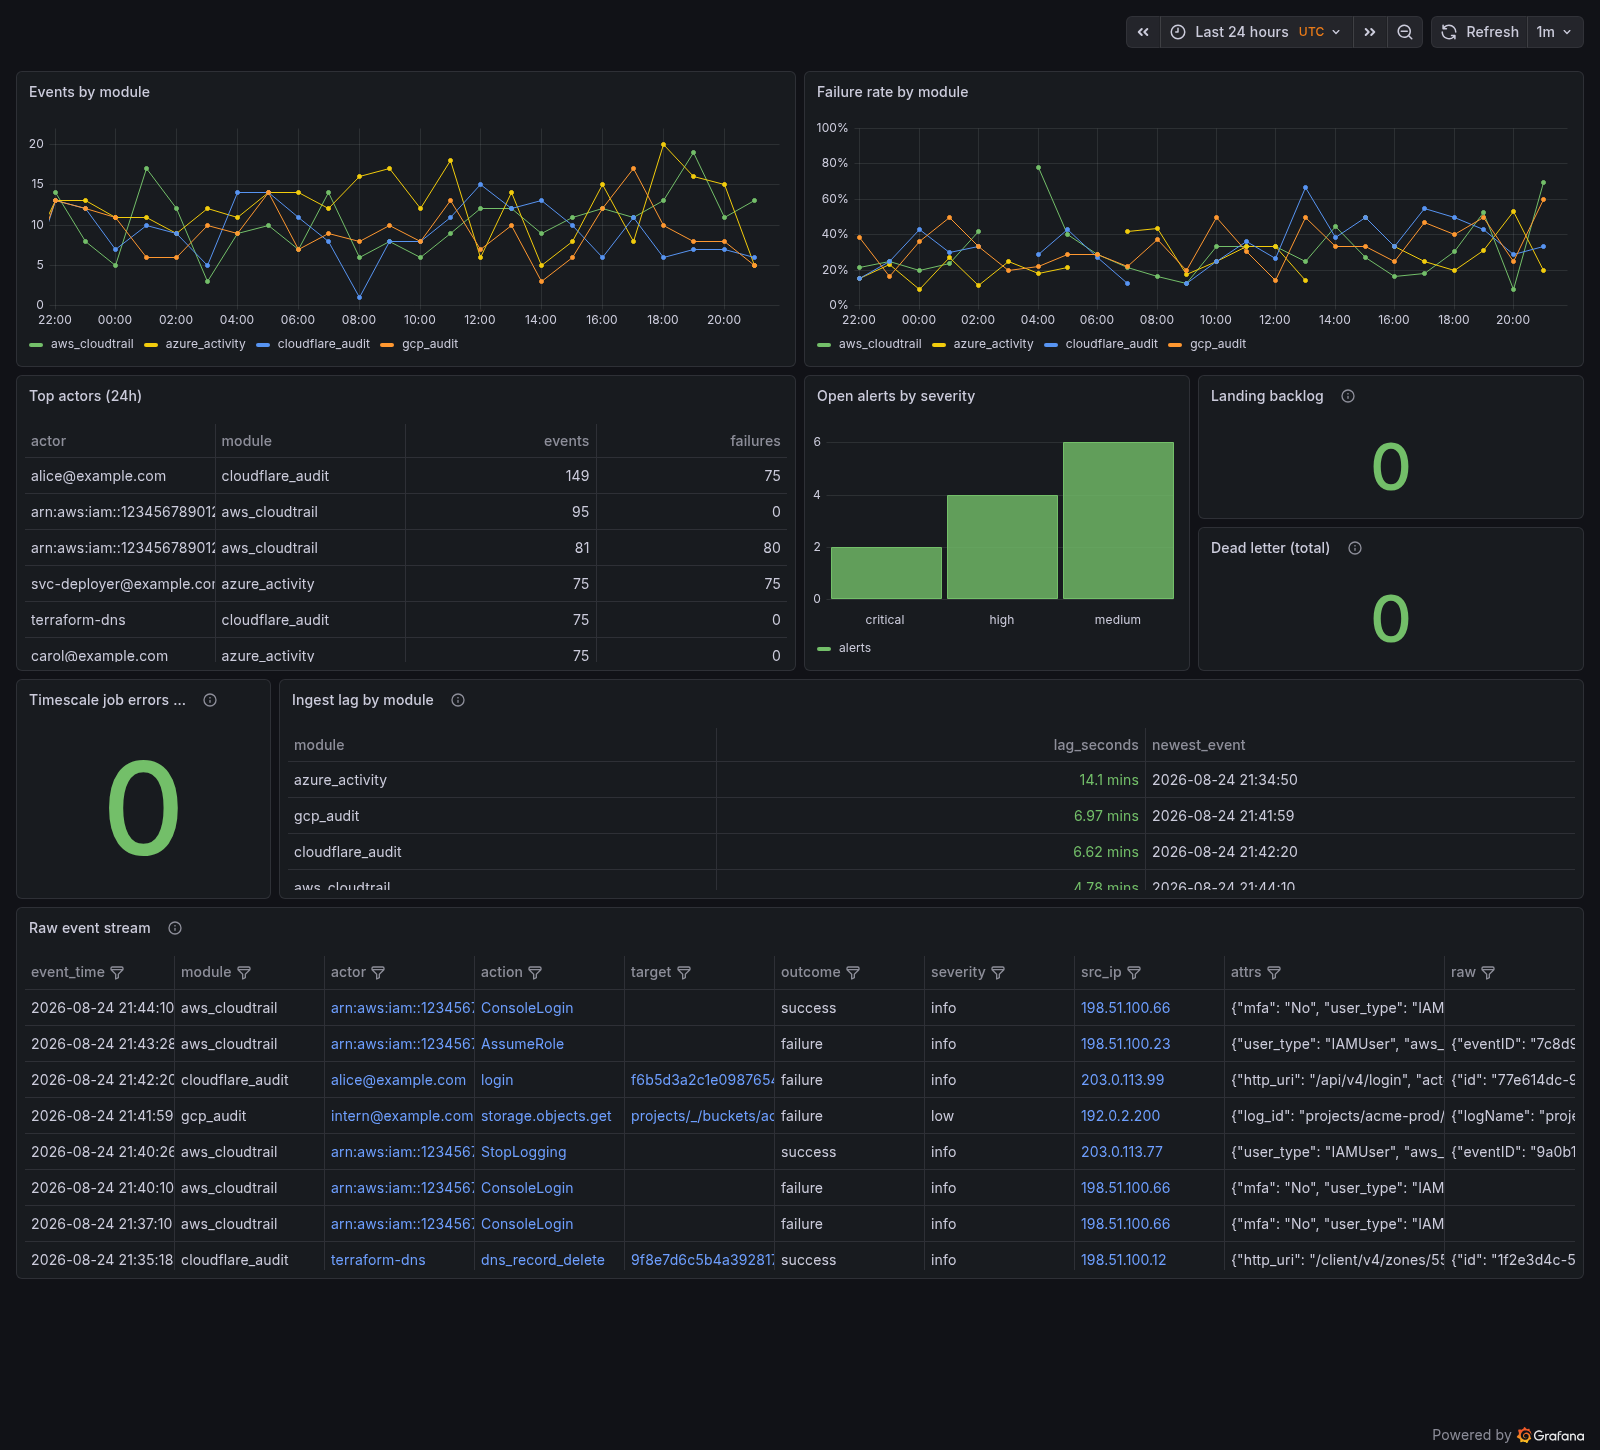
The Overview dashboard above is generated from make demo synthetic data—not a product mockup and not a real tenant.
One module owns the whole path
Most collection projects separate integrations into unrelated folders: a collector config over here, mappings somewhere else, a dashboard somebody exported six months ago, and detection rules maintained by another person who has never seen the parser.
CAIB treats a source as one module with an end-to-end contract. A module ships:
- collector or poller configuration;
- normalized field mapping;
- database migration hooks;
- a provisioned Grafana dashboard;
- seed detection rules;
- a dead-man rule;
- synthetic fixtures and tests;
- API notes containing the remaining live-verification checklist.
The normalized event keeps curated fields—actor, action, target, source IP, outcome, severity, and attributes—while preserving the raw vendor JSON. That supports cross-provider questions without deleting the evidence needed when a provider-specific detail matters.
The first shipped set covers:
- AWS CloudTrail through S3, SQS, and Vector;
- GCP Audit Logs through Pub/Sub and Vector;
- Azure Activity Log through an ARM REST poller;
- Cloudflare audit logs through a poller.
AWS currently ships seven seed rules. GCP, Azure, and Cloudflare ship five each. Slack, Zoom, and KnowBe4 have implementation recipes, not pretend checkmarks.
Boring infrastructure, deliberately
The core stack is intentionally unsurprising:
- Vector handles push-based sources and disk buffering.
- PostgreSQL 18 with TimescaleDB stores normalized events, raw payloads, alerts, health state, and aggregates.
- Grafana provides the operating and analyst surfaces.
- Small Python services run migrations, move landing rows into the event model, evaluate detections, and poll APIs.
Boring is not the same as simplistic. Audit data is append-heavy, time-oriented, repetitive, and frequently searched by substrings that vendors did not agree to normalize. TimescaleDB provides compression, retention policies, and continuous aggregates without turning the system into a distributed-database hobby project.
The default policy keeps events in row storage for seven days, compresses older chunks, and drops event detail after ninety days. Aggregates and alerts remain much longer because they are cheap.
There is also an HA overlay using three Patroni nodes, etcd, and HAProxy. The lab test writes continuously, kills the primary, waits for election, and asserts zero loss. Dashboard reads can use replicas while writes route only to the current primary.
That does not make a single-host Compose overlay a production HA architecture. The deployment guide explicitly calls out the real-host work: three etcd members, one database node per host, proper client addresses, redundant HAProxy or client-side multi-host connections, local storage, TLS verification, narrowed access rules, and backups.
A blueprint should reduce integration toil. It should not lie about physics.
The numbers are measured, not adjectives
make bench replays one million representative cloud and SaaS audit events through the real landing-to-loader path. The committed M-series laptop run measured:
| Measurement | Result |
|---|---|
| Raw vendor JSON | 1.03 GB |
| Loader throughput with deduplication and indexed search | 14,700 events/second |
| Hot row-store footprint including indexes | 2.0 GB |
| Compressed data footprint | 0.22 GB |
| Deduplicated replay against compressed chunks | 19,300 events/second, zero new rows |
| Thirty-day substring search | 0.14 seconds hot / 0.21 seconds compressed |
The headline compression ratio needs the boring footnote. The cold data is about 9.3 times smaller than the complete hot footprint, but pure data compression is closer to six times. Hot b-tree and trigram indexes account for much of the difference and do not exist on compressed chunks.
The analyst search index is also a measured trade-off. Without it, the loader reached about 31,200 events per second. With it, throughput dropped to 14,700—but arbitrary substring search became sub-second. For an audit SIEM, that is the correct trade. It is also recorded so an operator can disagree with evidence rather than branding.
The failures found before dogfooding
An external review round found several problems that the happy-path demo did not expose.
The detection loop caught database errors per rule so one broken rule would not kill the engine. Unfortunately, that also swallowed a lost database connection. After a restart or HA failover, the process could remain running while detection had stopped. The fix now re-raises when the connection is closed or broken so Compose can restart the process.
The system also had dead-man rules for sources but no heartbeat for the detection engine itself. A stopped engine cannot evaluate the rule intended to announce that it stopped. Loader and detector now stamp an operations heartbeat every cycle, health checks validate freshness, and the Overview dashboard exposes it. External monitoring still has to page someone; Docker marking a container unhealthy is not incident response.
One dashboard panel scanned all retained event chunks every minute to calculate ingest lag. It worked beautifully with demo data and would have become progressively more stupid in production. The query now uses aggregates plus a bounded recent window, and tests reject provisioned panels that read the raw event table without a time predicate.
The original first-run path also copied example passwords and exposed PostgreSQL and Grafana broadly. It now generates random credentials, binds to loopback by default, and refuses the example-password plus non-loopback combination unless explicitly overridden.
Those fixes are more interesting than a feature list. They show why “the containers started” is the beginning of verification, not the end.
Search, detections, and the original event
The analyst workflow is intentionally direct: search a string across actor, action, target, source IP, and curated attributes; filter by module and time; then open the original JSON when normalization is not enough.
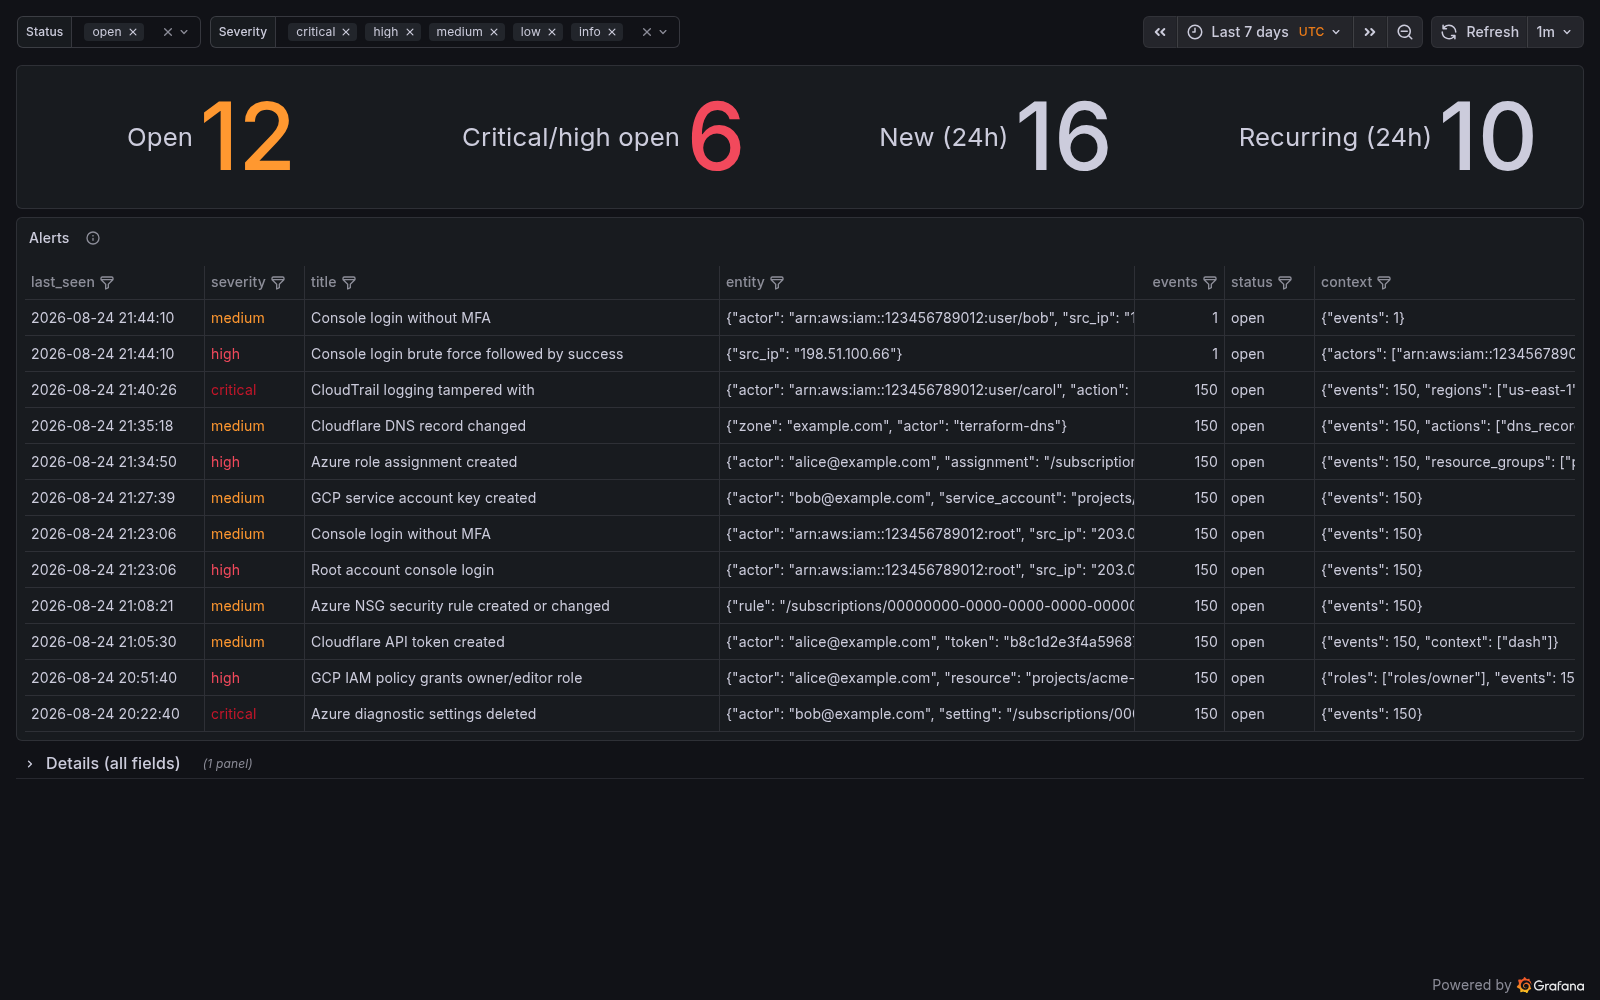
Detection rules are SQL with scheduling and alert metadata. Recurrences fold into an existing alert instead of producing an endless row storm. Rules can notify Slack using Block Kit formatting, and a Sigma converter handles an intentionally limited existence-rule shape rather than claiming full Sigma compatibility.
There are obvious next steps: a bounded read-only HTTP and MCP query layer, stronger alert lifecycle operations after dogfooding, retention for operational tables, image and dependency automation, live vendor verification, and more SaaS modules.
They remain next steps. A roadmap is not inventory.
What CAIB is—and is not
CAIB is a self-hosted starting point for teams that want cloud audit evidence, searchable history, detections, and an inspectable operating model without buying a black box.
It is not:
- a staffed SOC;
- a replacement for provider-side log retention and access controls;
- automatically safe on an internet-facing host;
- proven against every vendor’s live API edge cases yet;
- an excuse to skip capacity planning, TLS, monitoring, restore drills, or detection tuning.
The code is Apache-2.0. The repository is still private while live dogfooding and source-release cleanup happen. That is an availability boundary, not a maturity label hidden behind a GitHub badge.
The product page on In a Box Tools tracks the current release-candidate scope, evidence, and boundaries. The next useful milestone is not another architecture diagram. It is two weeks of real audit logs, a real restore drill, and a list of assumptions that reality proved wrong.
That is where a security tool stops being a convincing demo and starts becoming operational evidence.